Figure 1. The MER proto-oncogene and the Mertk gene expression ratio between BM-MSCs and RPE cells at different passages and among different passages of BM-MSCs. The first three
columns show the ratio of bone marrow mesenchymal stem cells (BM-MSCs) versus RPE cells. The last two columns show the ratio
among different passages of BM-MSCs. The asterisk (*) represents p<0.05. The sampling size for each group is 3.The error bars
are standard deviation (SD). The data were analyzed with one-way ANOVA. The Mertk gene expression of BM-MSCs was significant greater than RPE cells at P0 and P1.
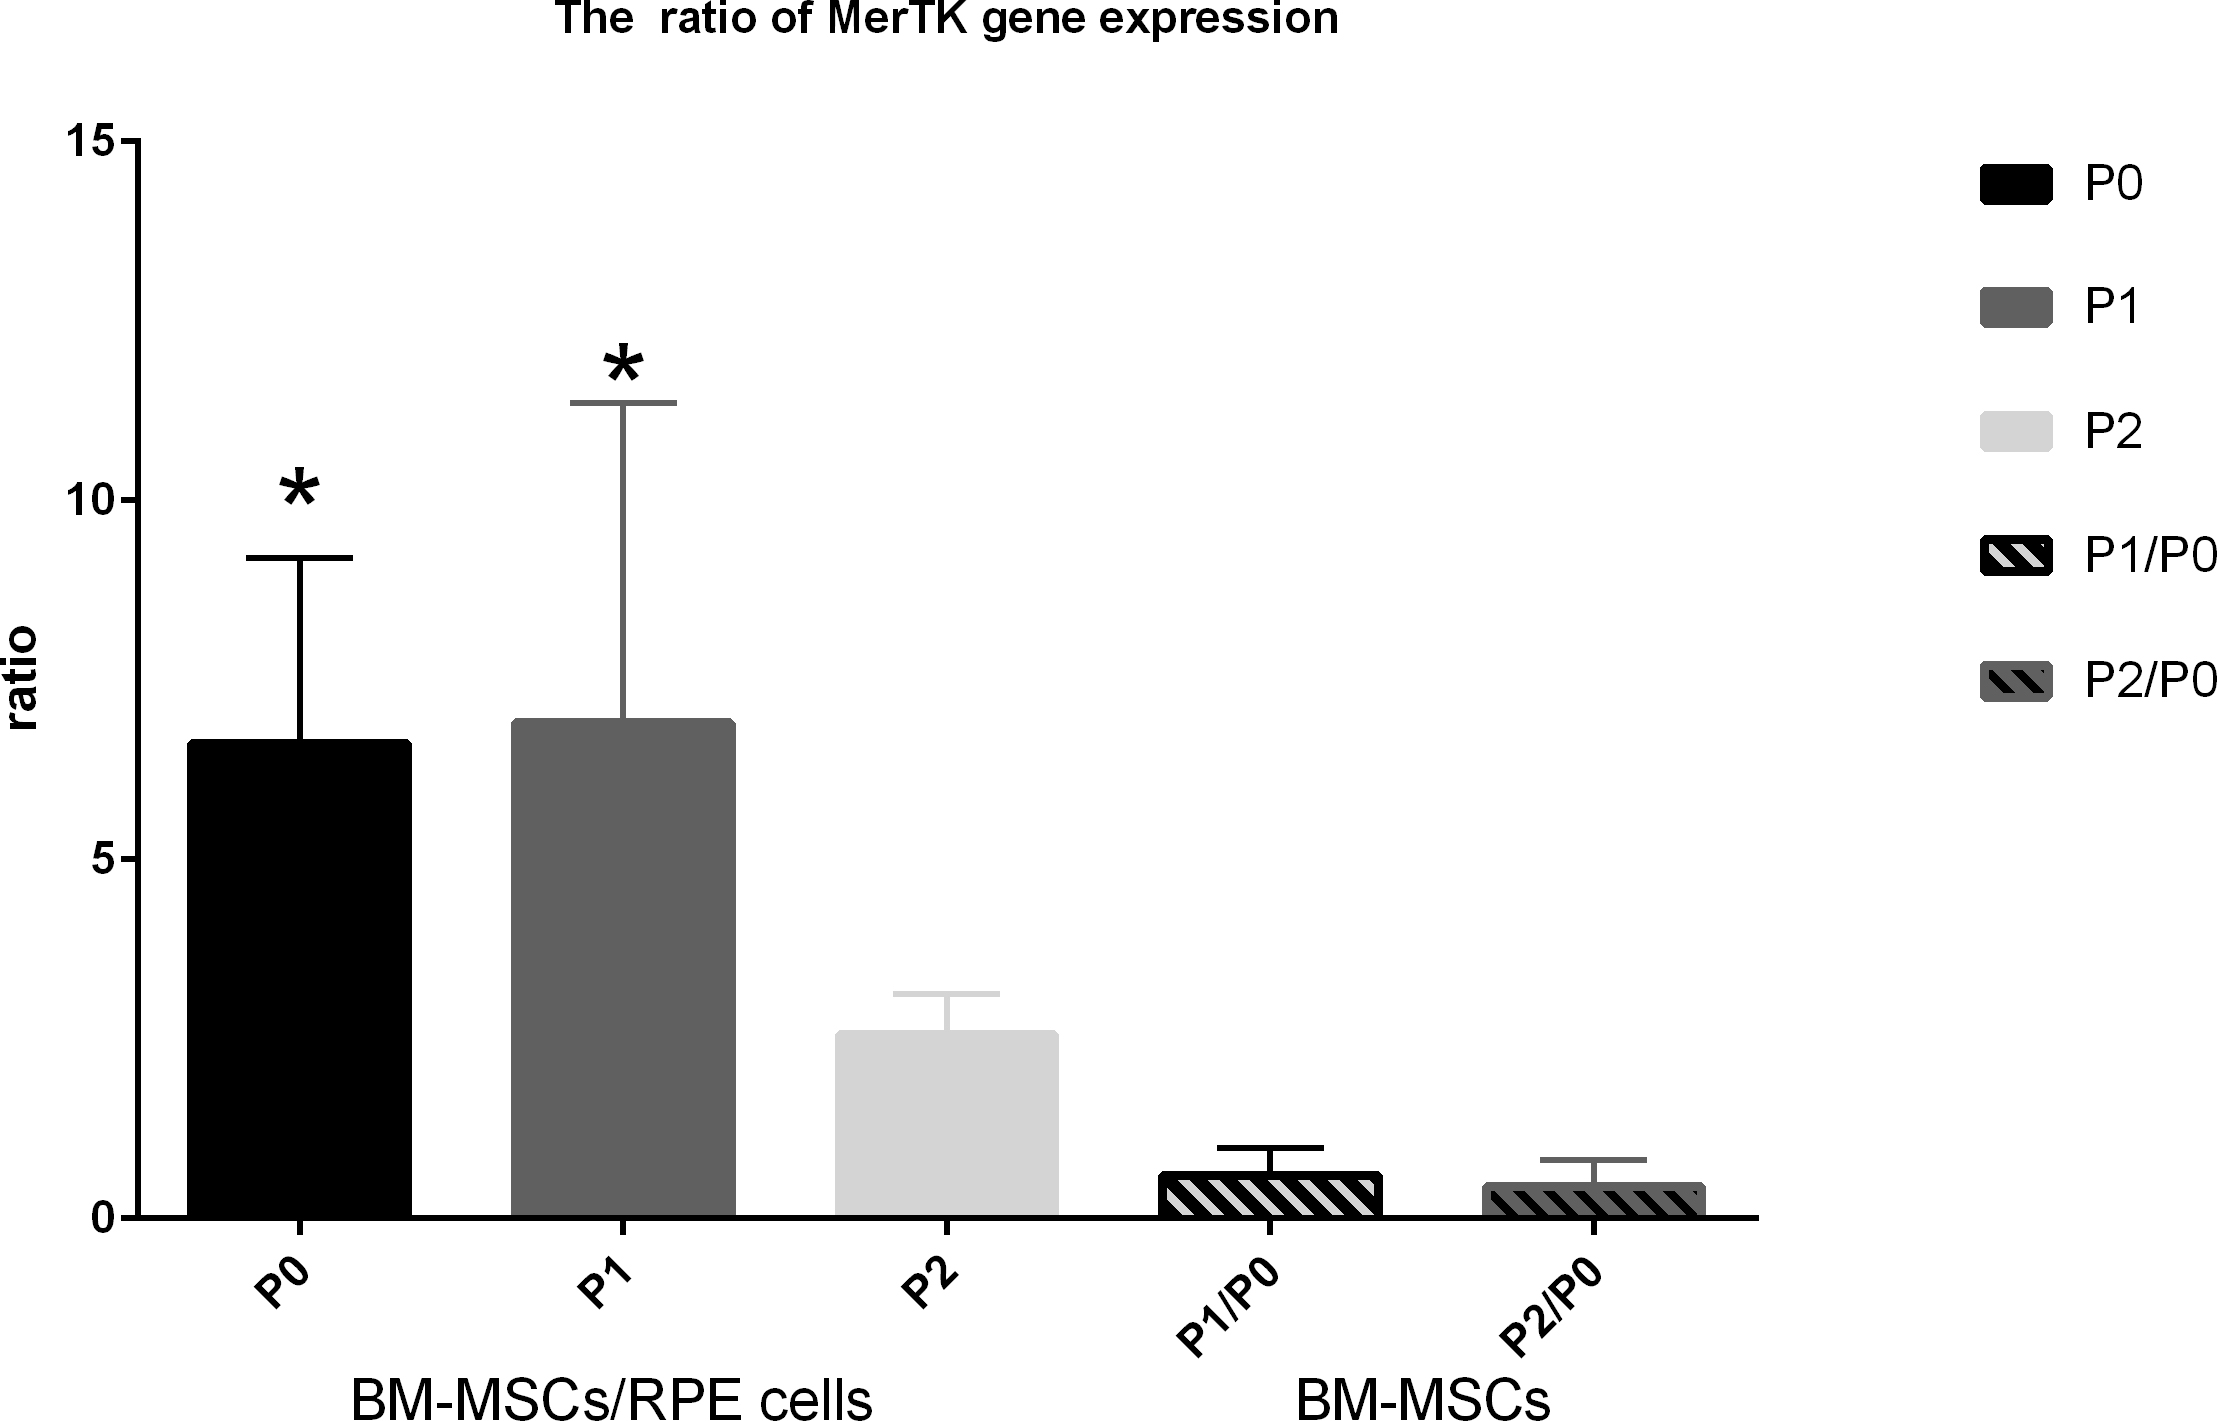
 Figure 1 of
Peng, Mol Vis 2017; 23:8-19.
Figure 1 of
Peng, Mol Vis 2017; 23:8-19.