Figure 2 of
Shpak, Mol Vis 2017; 23:799-809.
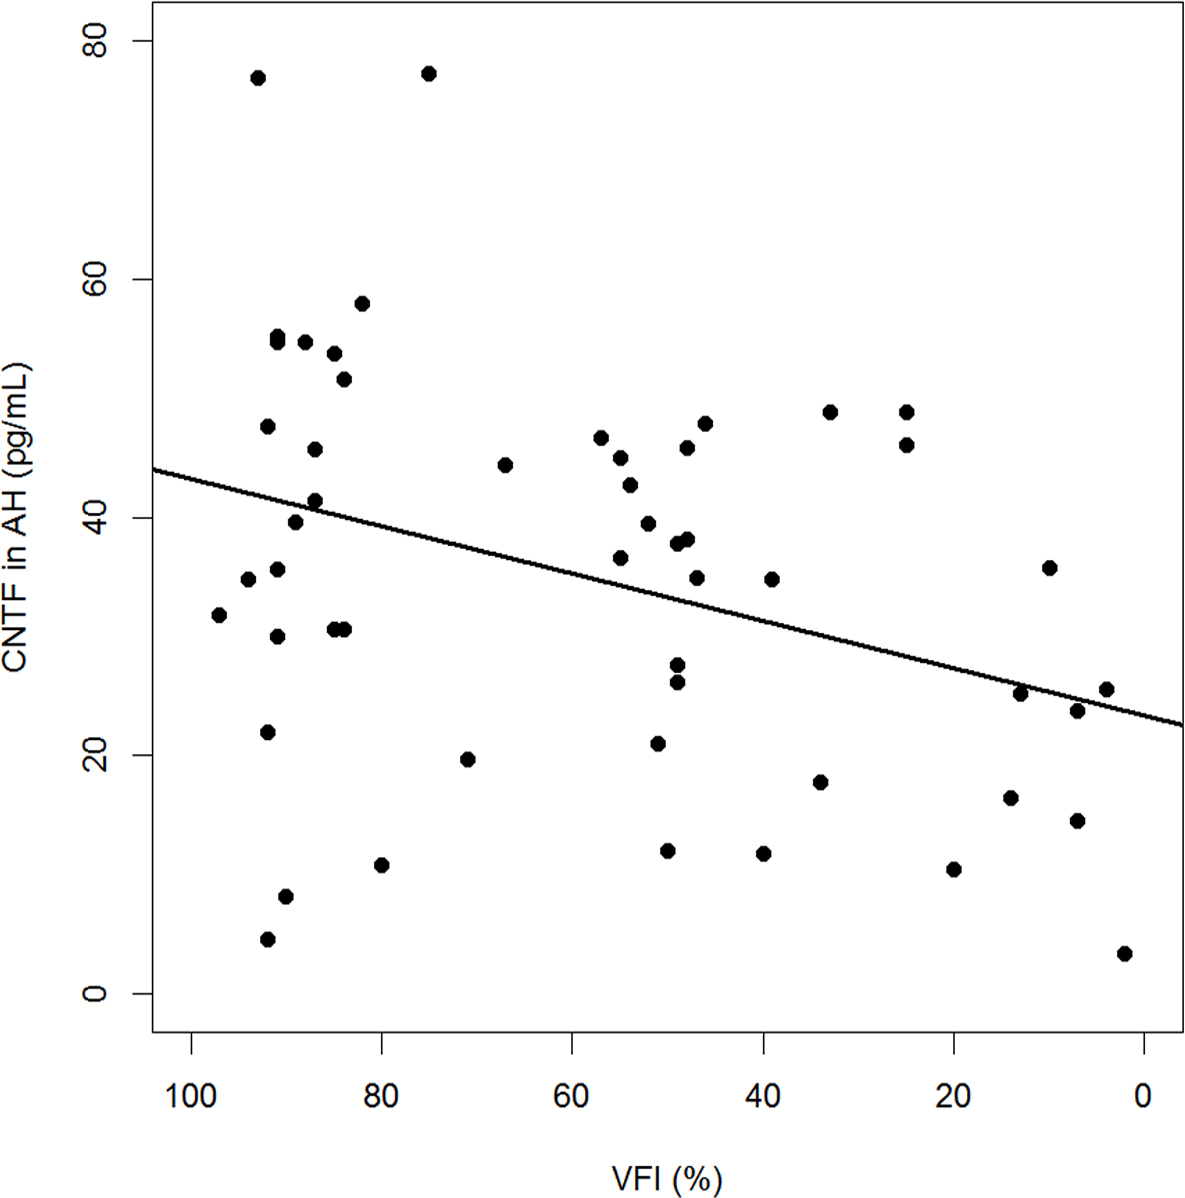
Figure 2.
Plot of the CNTF concentration in aqueous humor versus the Humphrey visual field index. The solid line represents the linear regression fit. Note the reversed x-axis.
 Figure 2 of
Shpak, Mol Vis 2017; 23:799-809.
Figure 2 of
Shpak, Mol Vis 2017; 23:799-809.