Figure 1 of
Shpak, Mol Vis 2017; 23:799-809.
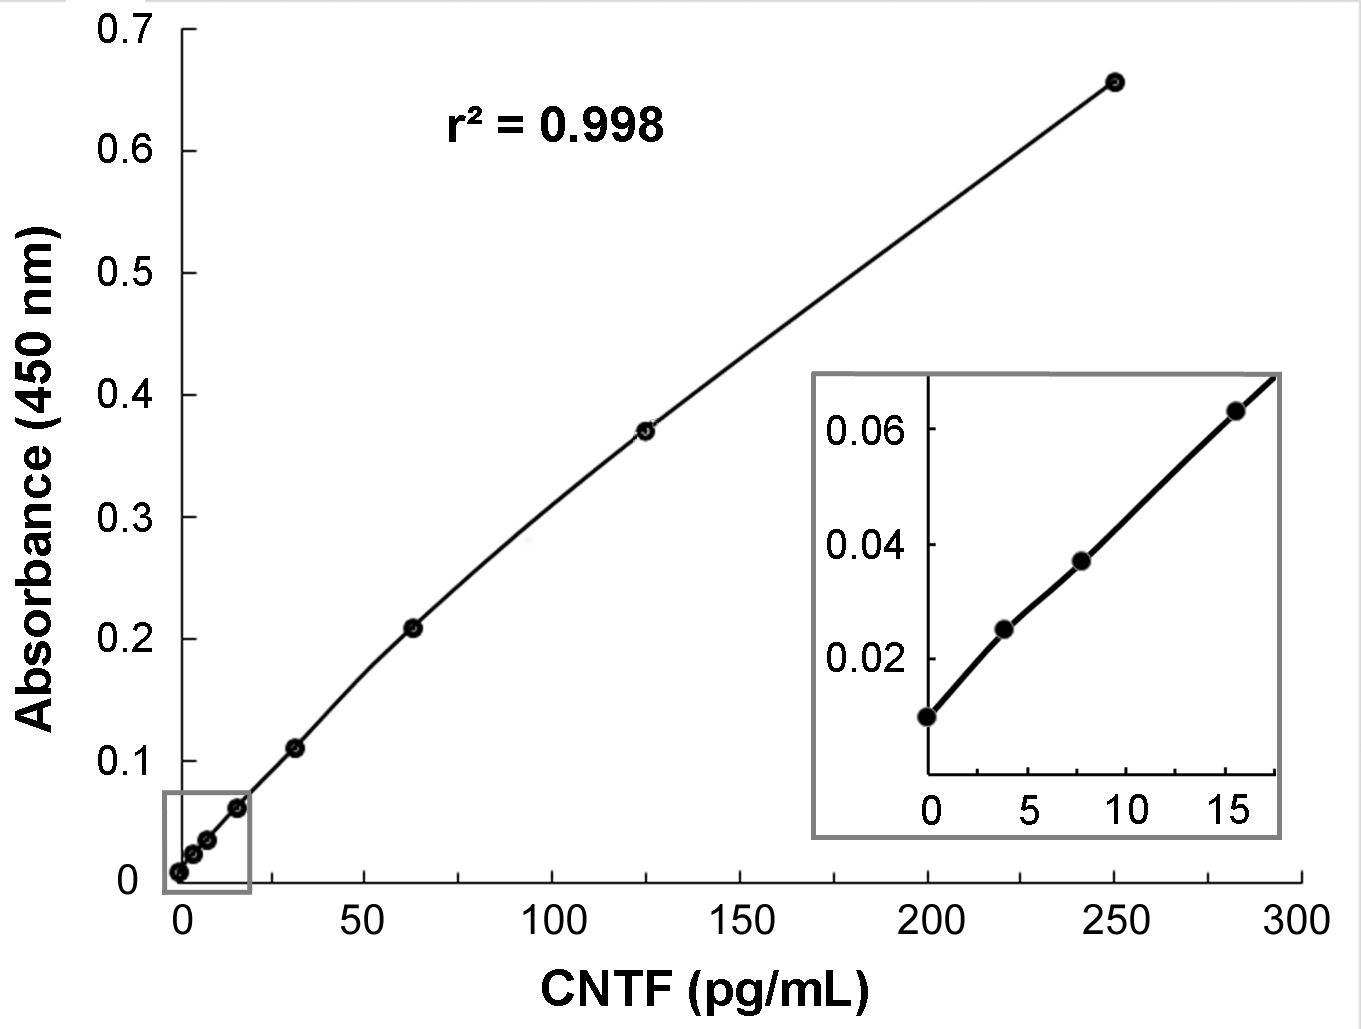
Figure 1.
Representative CNTF standard curve obtained using Human CNTF Quantikine ELISA kits with 1% BSA in PBS as diluent (calibrating solutions 0–250 pg/ml). The inset is an enlargement of the 0–17.5 pg/ml portion of the graph.
 Figure 1 of
Shpak, Mol Vis 2017; 23:799-809.
Figure 1 of
Shpak, Mol Vis 2017; 23:799-809.