Figure 1. The alternation of refractive error, axial length, and intraocular pressure in Group F during the experiment. A: Refractive error (RE) changing course in 3 weeks. B: Axial length (AL) changing course in 3 weeks. C: Intraocular pressure (IOP) changing course in 3 weeks. D: Histogram analysis the difference in the RE, AL, and IOP between the right and left eyes before and after the experiment.
*p<0.05 (n=6). (L: left; R: right).
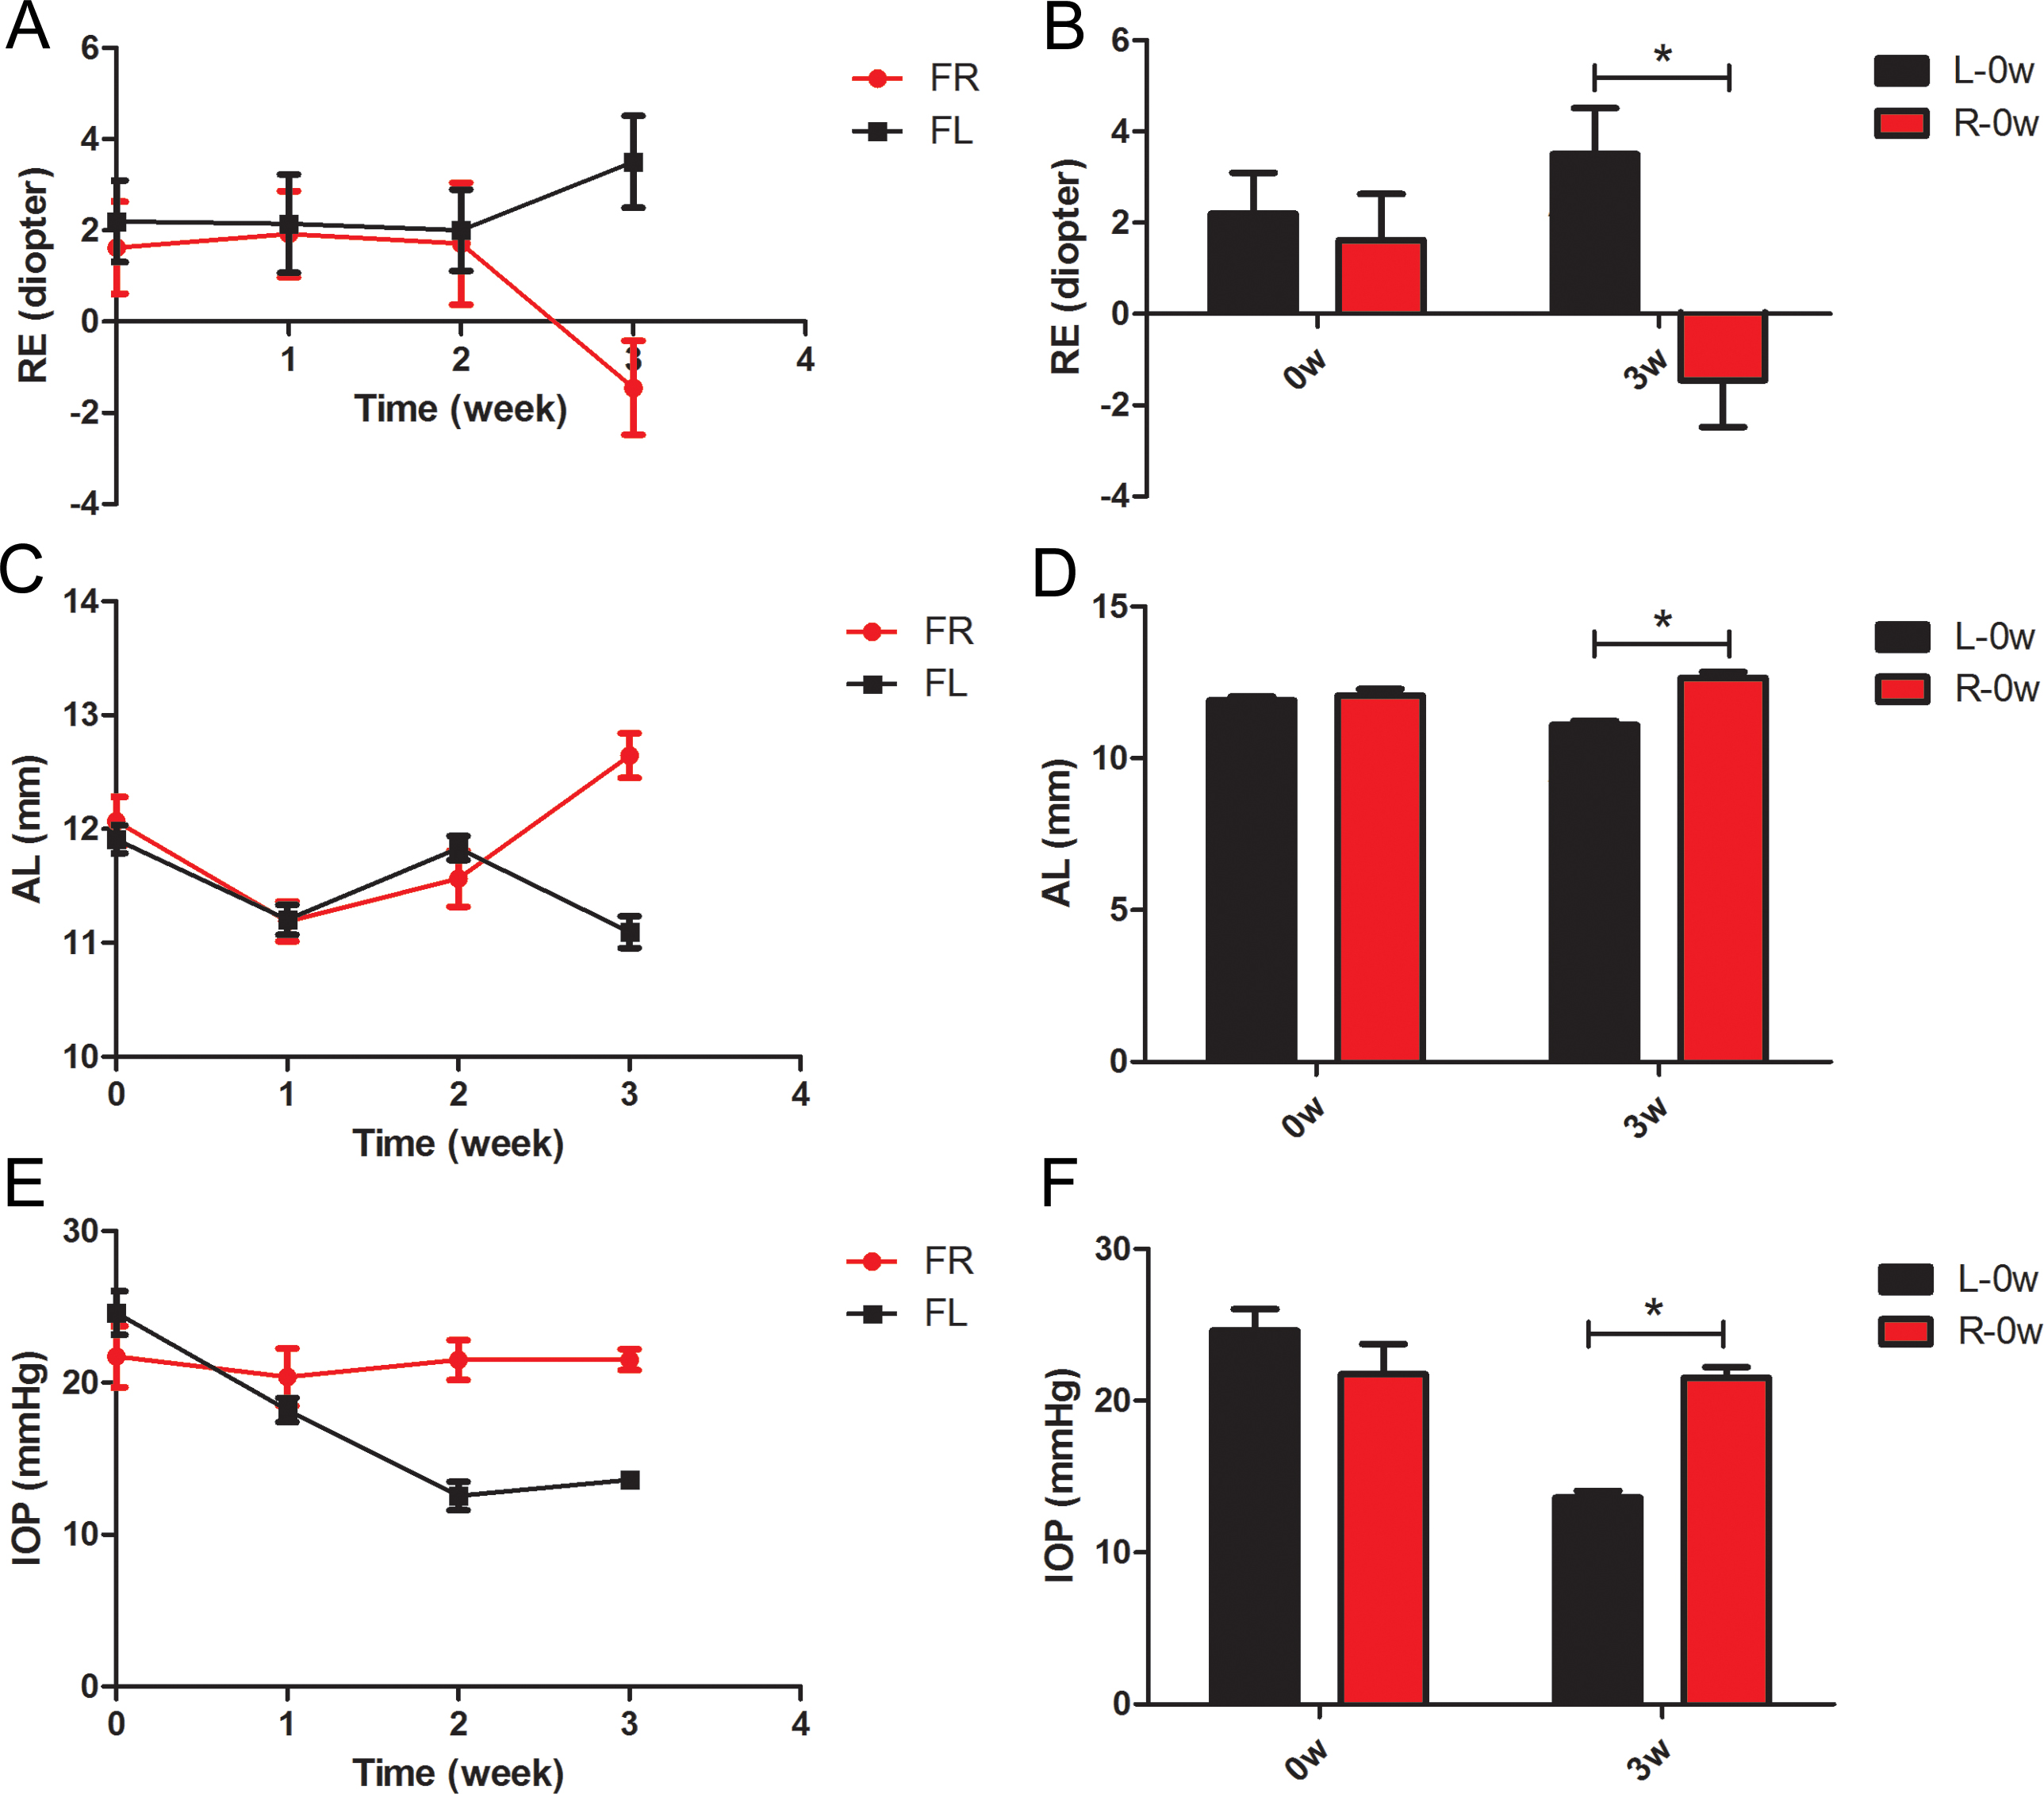
 Figure 1 of
Liu, Mol Vis 2017; 23:785-798.
Figure 1 of
Liu, Mol Vis 2017; 23:785-798.