Figure 8. Comparative changes in microglia/monocyte infiltration, as well as CCL2 and CCR2 and IL-1 beta and TNF-alpha expression. A: The number of OX42-positive cells increased rapidly at as early as 1 day after light exposure and peaked at 3 days. B: The increasing number of ED1-positive cells in the outer retina occurred just following the infiltration of OX42-positive
cells and peaked at 7 days. A, B: The expression patterns of CCL2 and CCR2 and interleukin (IL)-1 beta and tumor necrosis factor (TNF)-alpha were consistent
with the infiltration of OX42-positive cells, with the peak at 3 days.
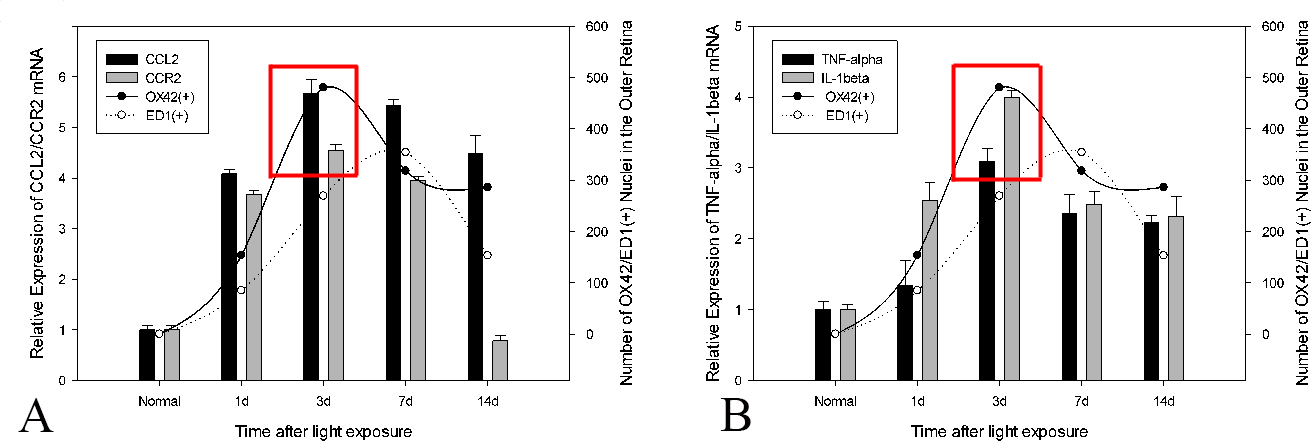
 Figure 8 of
Feng, Mol Vis 2017; 23:765-777.
Figure 8 of
Feng, Mol Vis 2017; 23:765-777.