Figure 7. Western blot analysis of CCL2 and CCR2 expression after extensive light exposure. A, B: CCL2 protein expression began to increase at 1 day and peaked at 3 days. A, C: CCR2 protein expression began to increase at 3 days and peaked at 7 days after light exposure. Actin protein expression
served as the loading control. The mean ± standard deviation of data from three independent experiments is shown, *,p<0.05;
**,p<0.01.
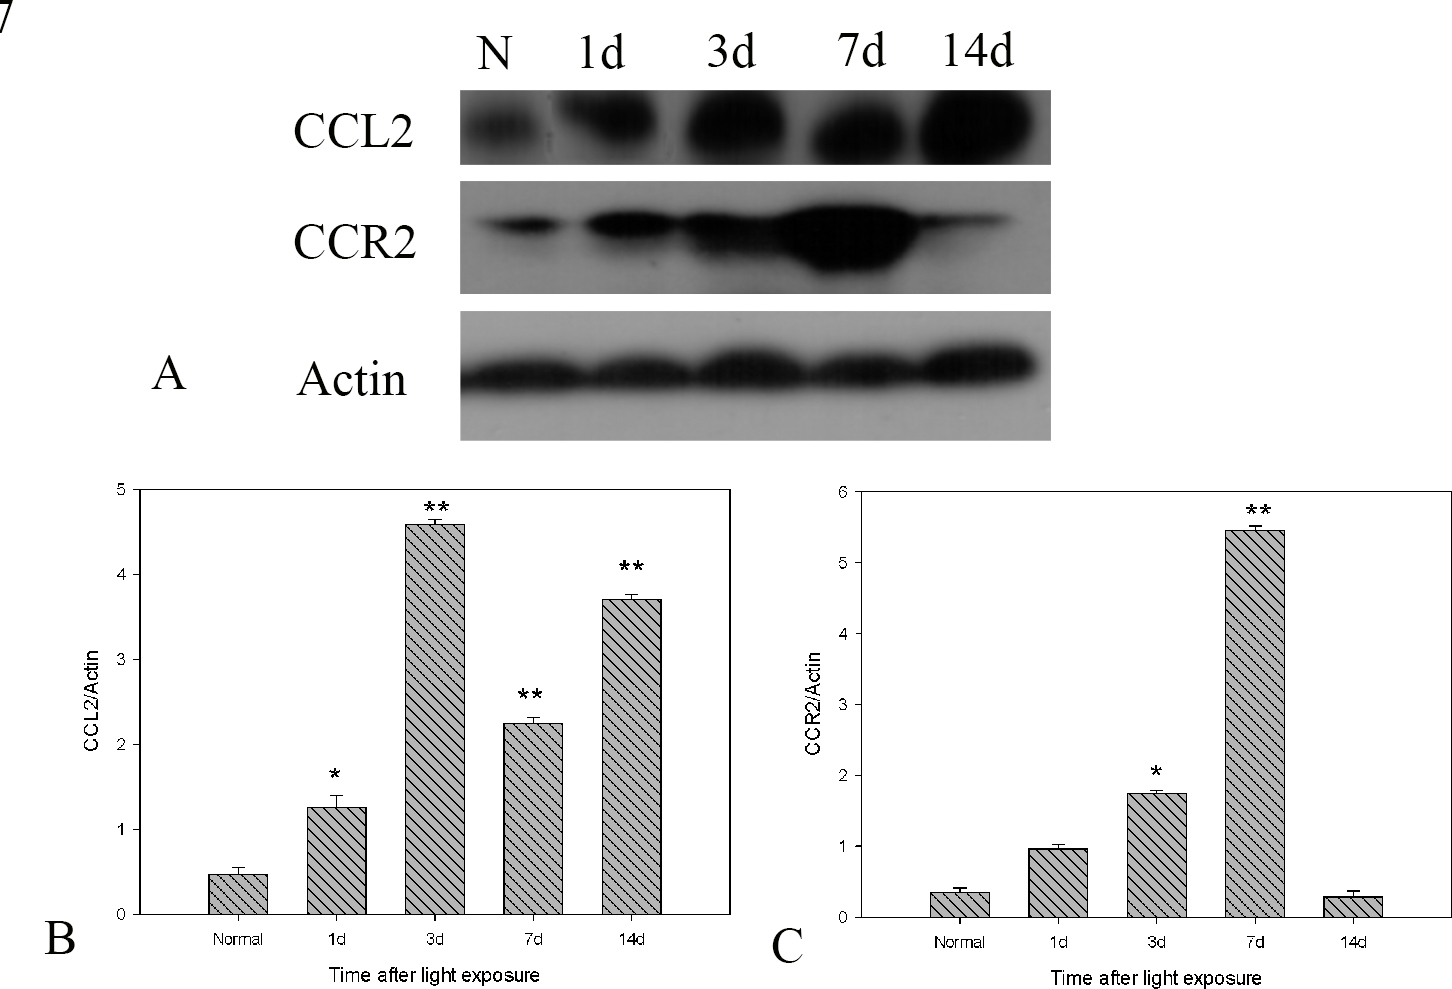
 Figure 7 of
Feng, Mol Vis 2017; 23:765-777.
Figure 7 of
Feng, Mol Vis 2017; 23:765-777.