Figure 6. Real-time PCR of CCL2 and CCR2 and IL-1 beta and TNF-alpha expression after extensive light exposure. A, B: The mRNA of CCL2 and CCR2 began to increase as early as 1 day, peaked at 3 days, and slowly decreased. C, D: The expression pattern of interleukin (IL)-1 beta and tumor necrosis factor (TNF)-alpha was consistent with the patterns
of CCL2 and CCR2. GAPDH expression served as the loading control. The mean ± standard deviation of data from three independent
experiments is shown, **, p<0.01.
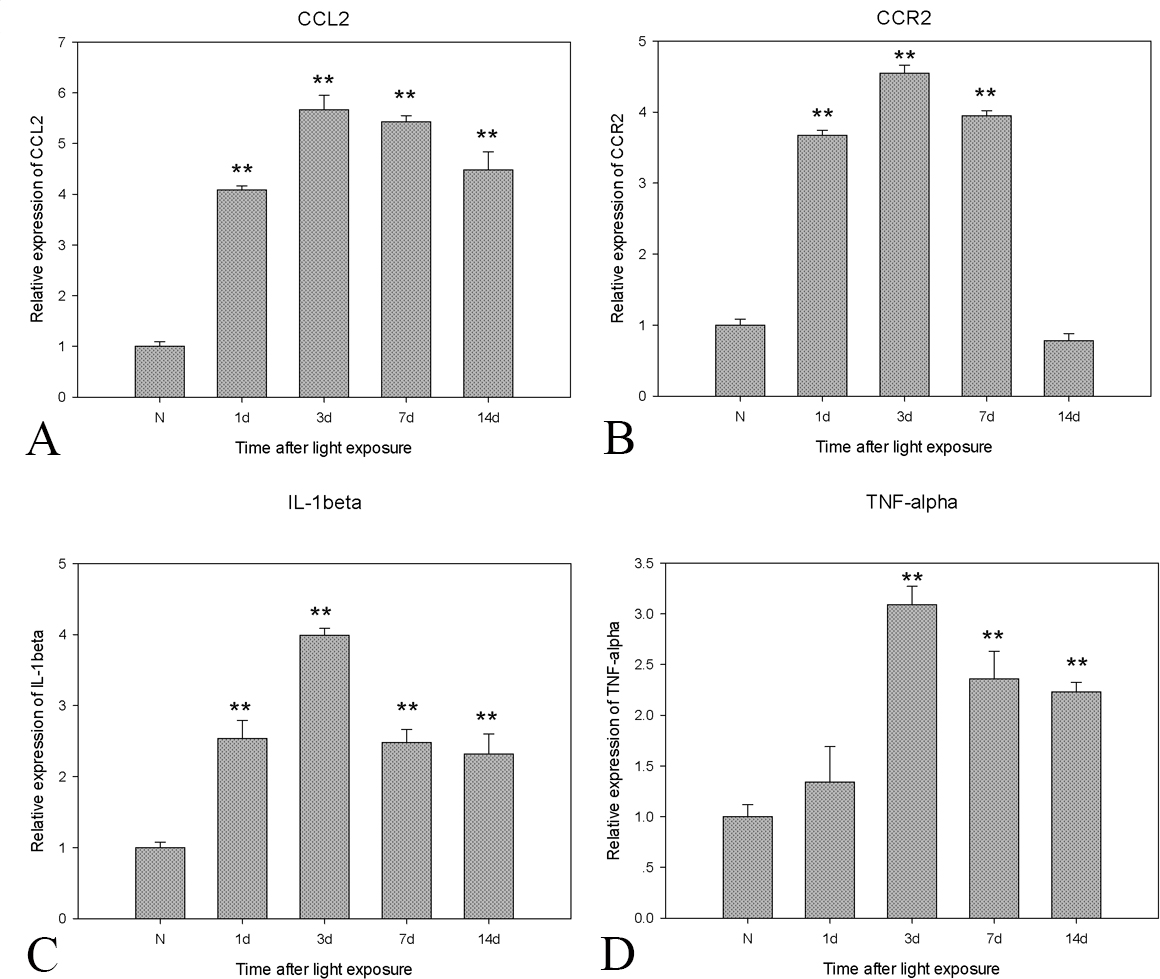
 Figure 6 of
Feng, Mol Vis 2017; 23:765-777.
Figure 6 of
Feng, Mol Vis 2017; 23:765-777.