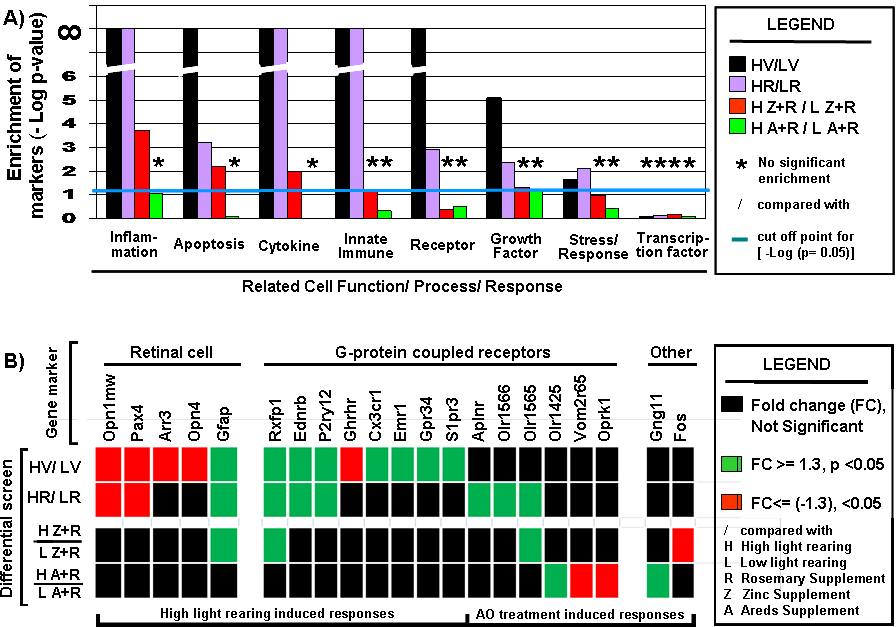
Figure 9. Cell function and cell response trends.
A: Differential selection leads to enrichment and depletion of genes defining specific cell function and cell response. A focused
cell function analysis was performed. A Boolean search for specific text strings was used to mine the
NCBI gene database. We specifically mined for genes pertaining to the following categories (inflammation, apoptosis, cytokine,
innate immune, receptor, growth factor, stress response, and transcription factor). Genes related to each text string were
mined, and only rat genes were retrieved. Each gene list retrieved was aligned against a non-redundant gene list representing
the microarray used, and this, in turn, was aligned to the differential comparison output data. From these alignments, we
extracted the information needed to set up and perform a Fisher’s exact test for each functional category. P>0.05 indicates
the absence of significant enrichment. –Log (p value) was plotted so changes in a single unit represent, a ten-fold difference.
The blue line just above the value of 1 indicates the equivalent cut-off point for a p value of 0.05.
B: Summary of the differential expression status for retinal cell associated gene markers and G-protein coupled protein associated
gene markers.
 Figure 9 of
Wong, Mol Vis 2017; 23:718-739.
Figure 9 of
Wong, Mol Vis 2017; 23:718-739.