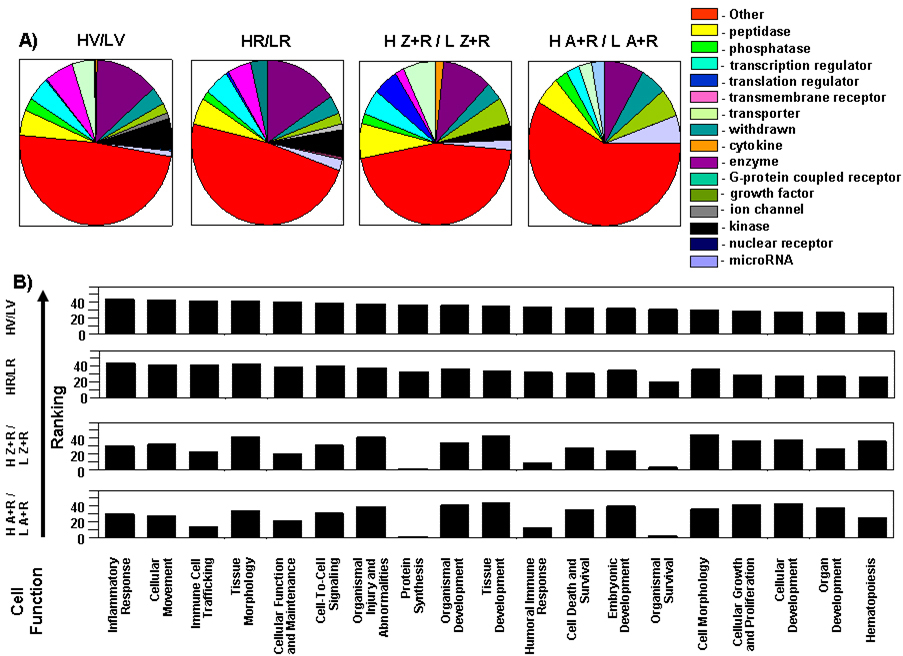
Figure 8. Molecular cell function analyses demonstrate differences in gene profiles. An Ingenuity Pathway Analysis (IPA) core analysis
(
Ingenuity® Systems) was performed using the differential gene marker data sets for (HV/LV), HR/LR, H Z+R/L Z+R, and H A+R/L A+R (Appendix
7, Appendix 8, Appendix 9, Appendix 10 and Appendix 11).
A: Genes annotated by a single function (see the legend for designations) were extracted and used to generate a pie chart for
each dietary treatment (H/L). Molecules with more complex multiple functions, or with unknown functions are categorized as
“other.” Each dietary supplementation resulted in a different differential retinal gene profile with respect to a transition
from a low to high light rearing environment.
B: The information underlying the pathway analysis of each differential gene list and the IPA knowledge base was extracted.
In total, 44 cell function or process categories were observed between the four differential comparisons. Not all categories
are necessarily represented in each differential comparison. For each functional category in each comparison, the best matched
pathway per category was ranked. The top 19 (HV/LV) ranked functional categories are graphed in reverse order. The corresponding
ranking for the same functional categories for the different antioxidant supplemented comparisons are provided below the HV/LV
graph. Comparison of individual rankings for each category from each differential comparison shows again that the functional
nature of each set of genes is different. From a visual inspection HV/LV is more similar to the pattern seen in HR/LR and
[H Z+R/LZ+R] is more similar with [H A+R/ L A+R].
 Figure 8 of
Wong, Mol Vis 2017; 23:718-739.
Figure 8 of
Wong, Mol Vis 2017; 23:718-739.