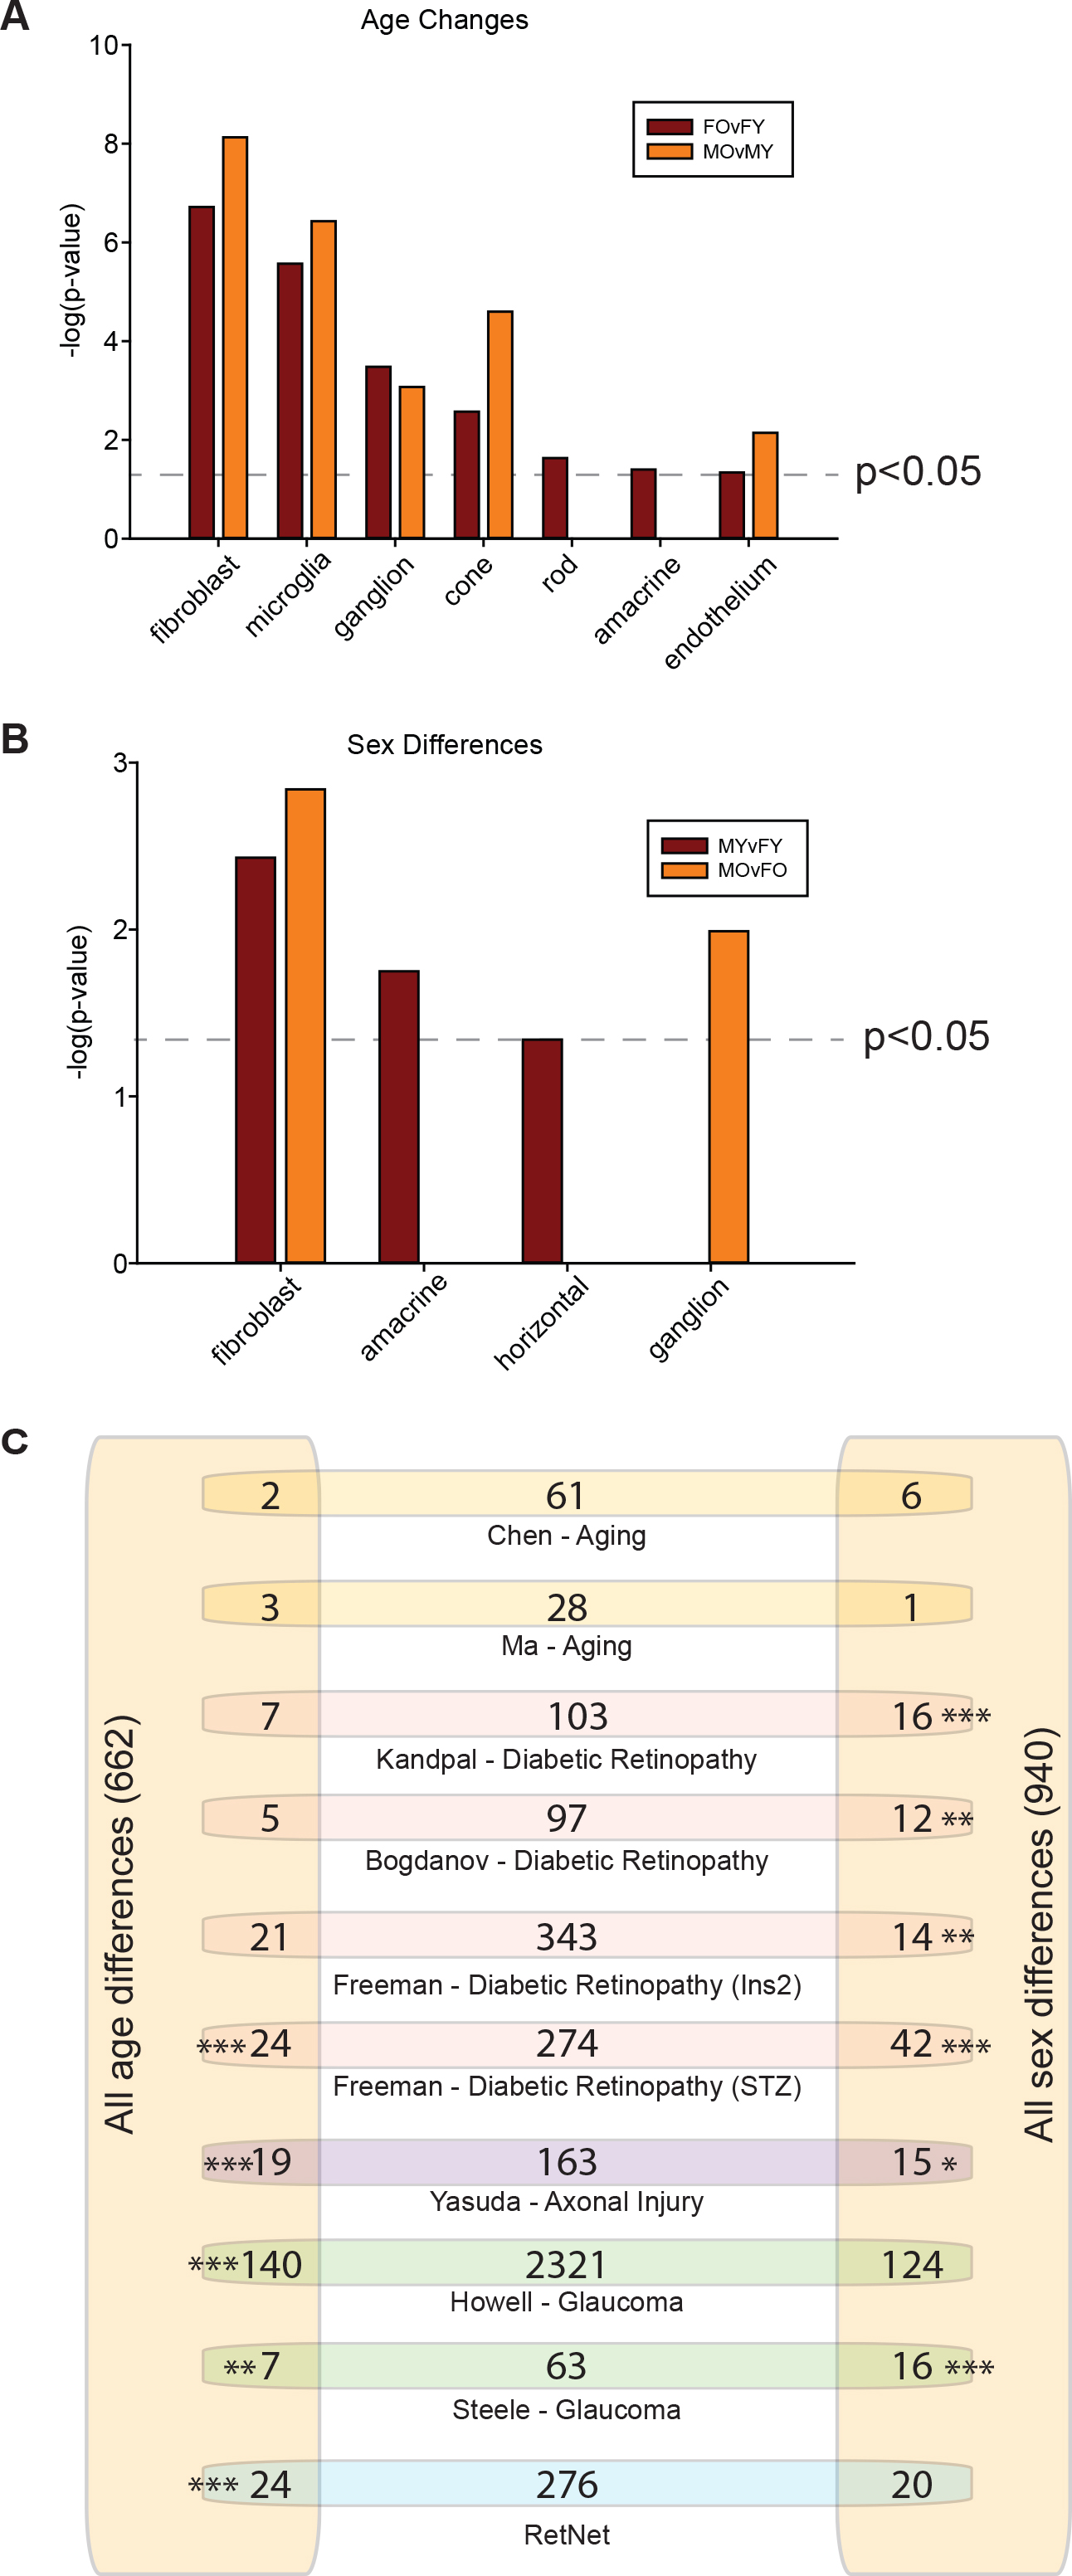
Figure 4. Enrichment of sex- and age-related changes in cell type–specific transcripts of the mouse retina. Retinal cell type–specific
transcripts from previous reports [
29,
30] were compared to each pair-wise set of age- (
A) and sex- (
B) related changes, and p values were calculated using Fisher’s exact test. Dashed lines indicate significant over-representations
of specific retina cell types with sex- and age-dependent changes in gene expression.
C: Comparisons to disease model differential gene expression data sets demonstrate significant overlap with the age- and sex-
differences observed in this study (exact hypergeometric test, Benjamini-Hochberg multiple testing correction, *p<0.05, **p<0.01,
***p<0.001).
 Figure 4 of
Du, Mol Vis 2017; 23:707-717.
Figure 4 of
Du, Mol Vis 2017; 23:707-717.