Figure 1. Differential sex- and age-related retina gene expression in the microarray analyses. A: Of the 25,697 probes on the microarray, 10,251 were positive for corresponding gene expression in the retina, i.e., passed
all filtering. B: Comparison of pair-wise age-related changes in both sexes with the number of genes, direction of change, and intersections
in respective groups (FO = female old, FY = female young, MO = male old, MY = male young). C: Sex differences in gene expression in young and old mice. D: Hierarchical clustering of all gene expression difference with age or between sexes. Samples segregated by sex and age.
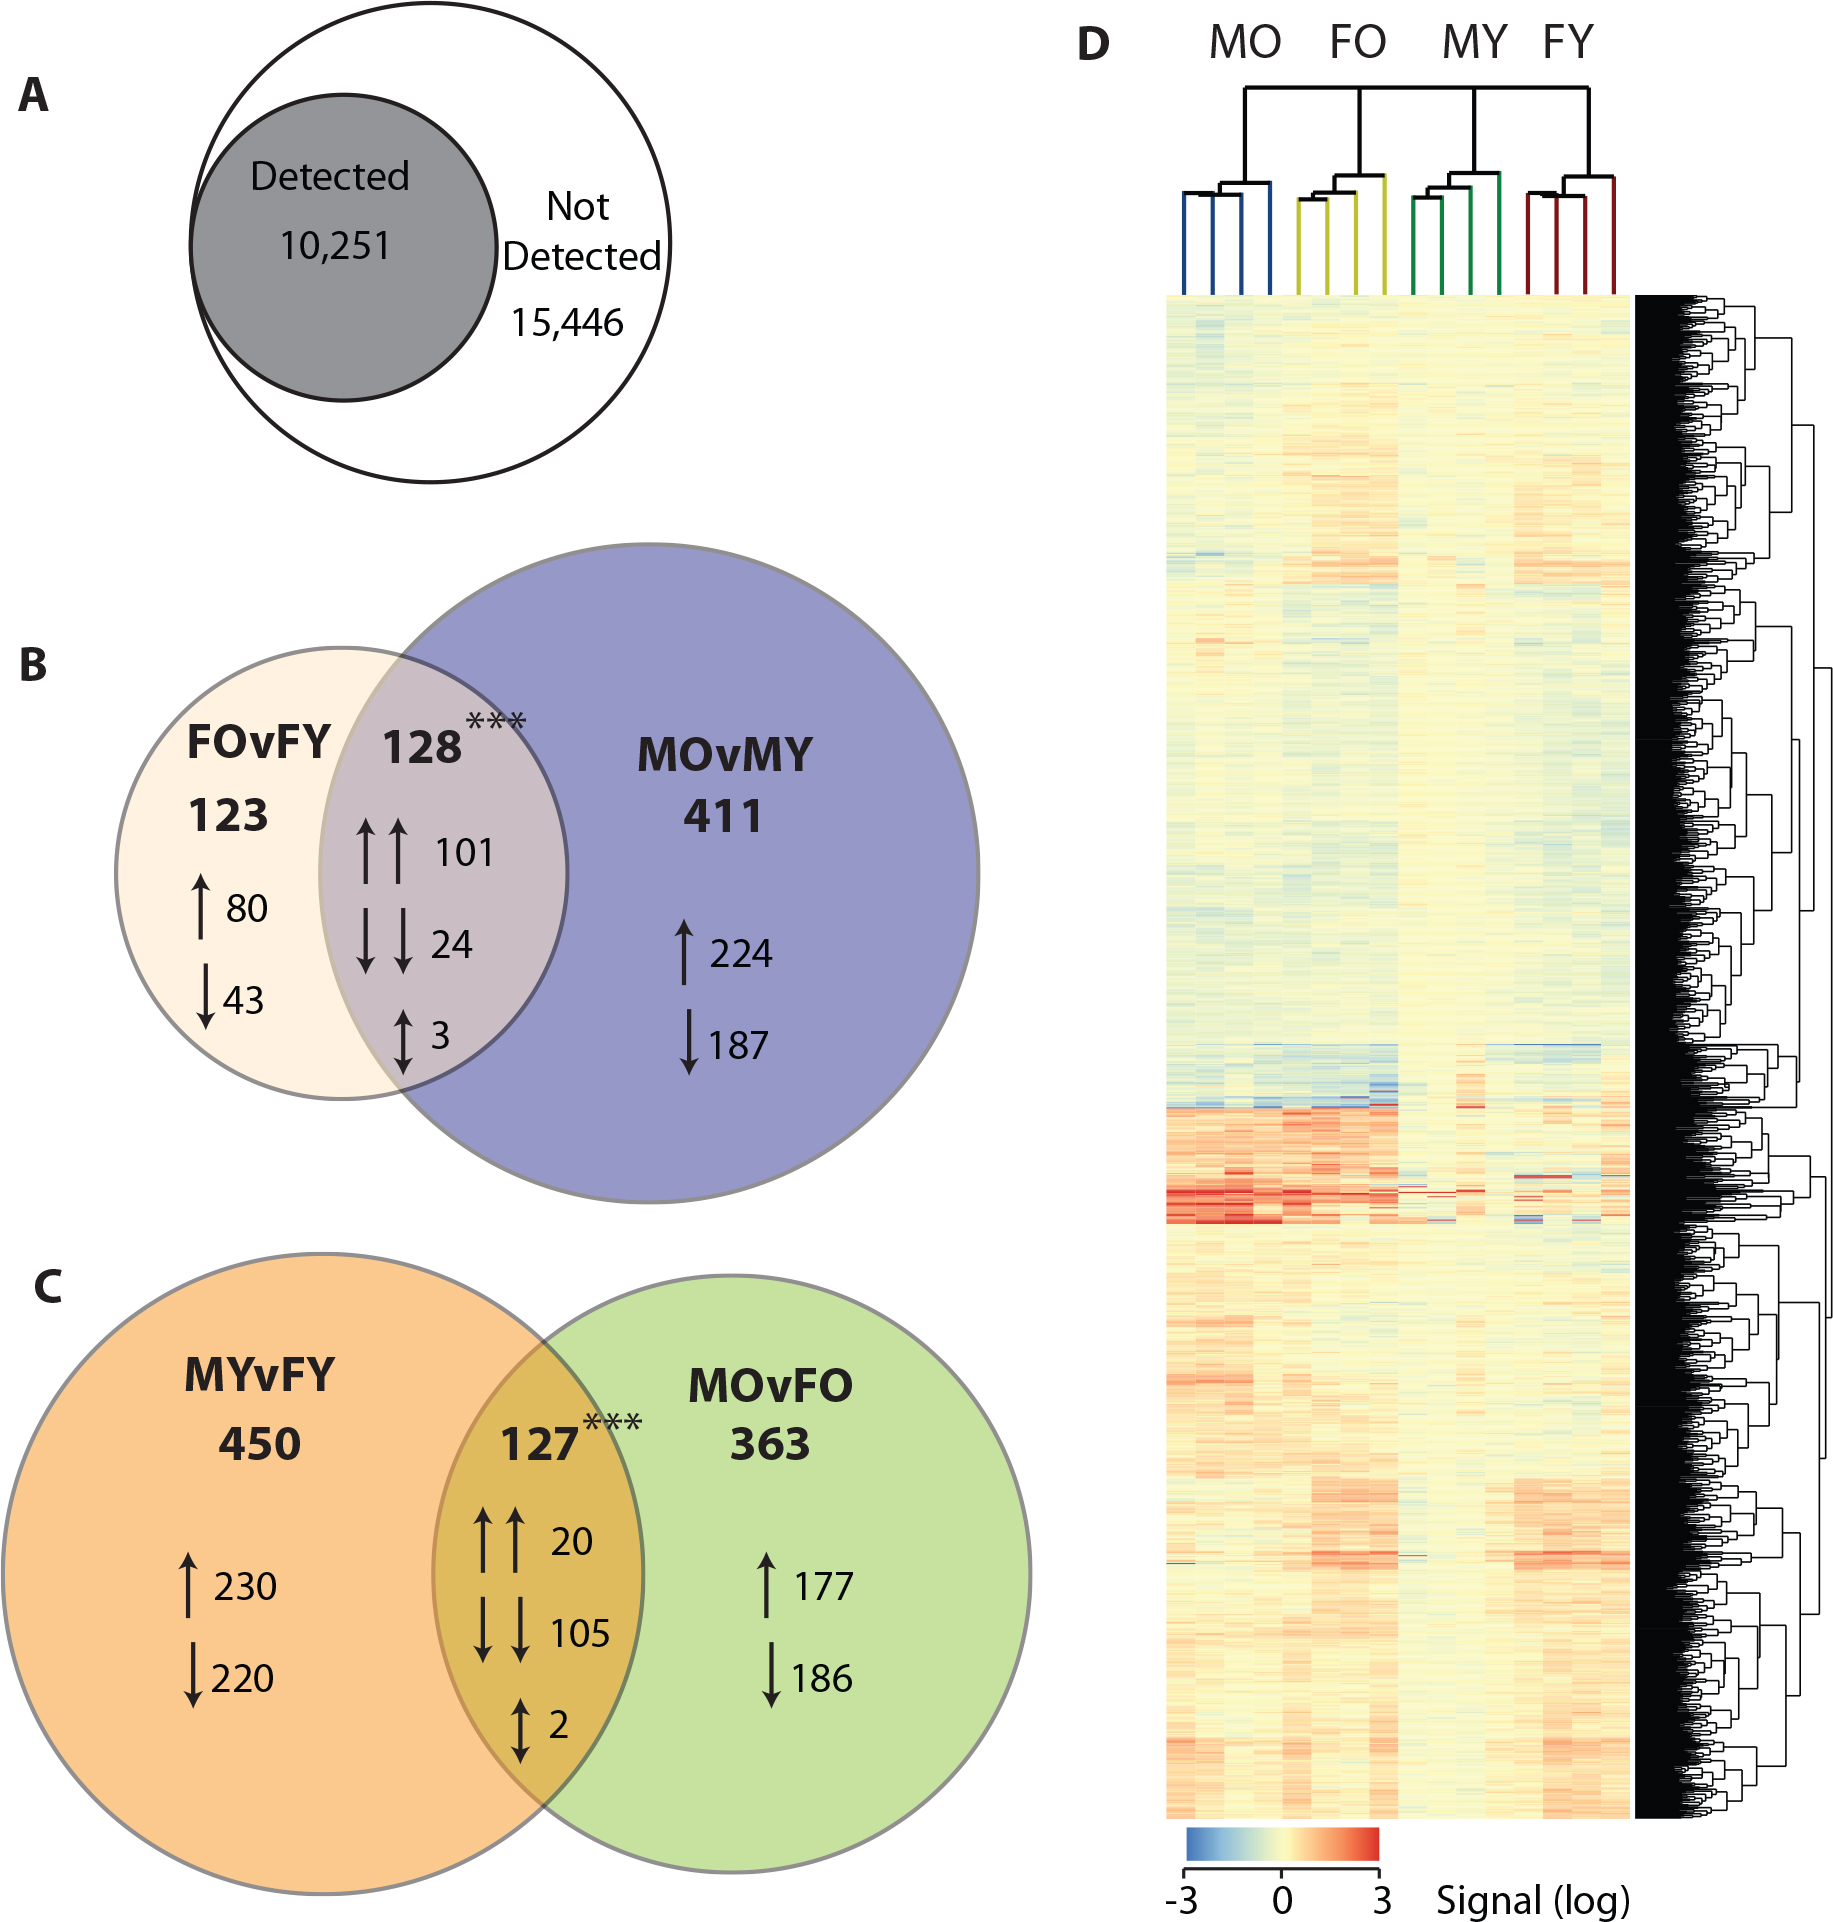
 Figure 1 of
Du, Mol Vis 2017; 23:707-717.
Figure 1 of
Du, Mol Vis 2017; 23:707-717.