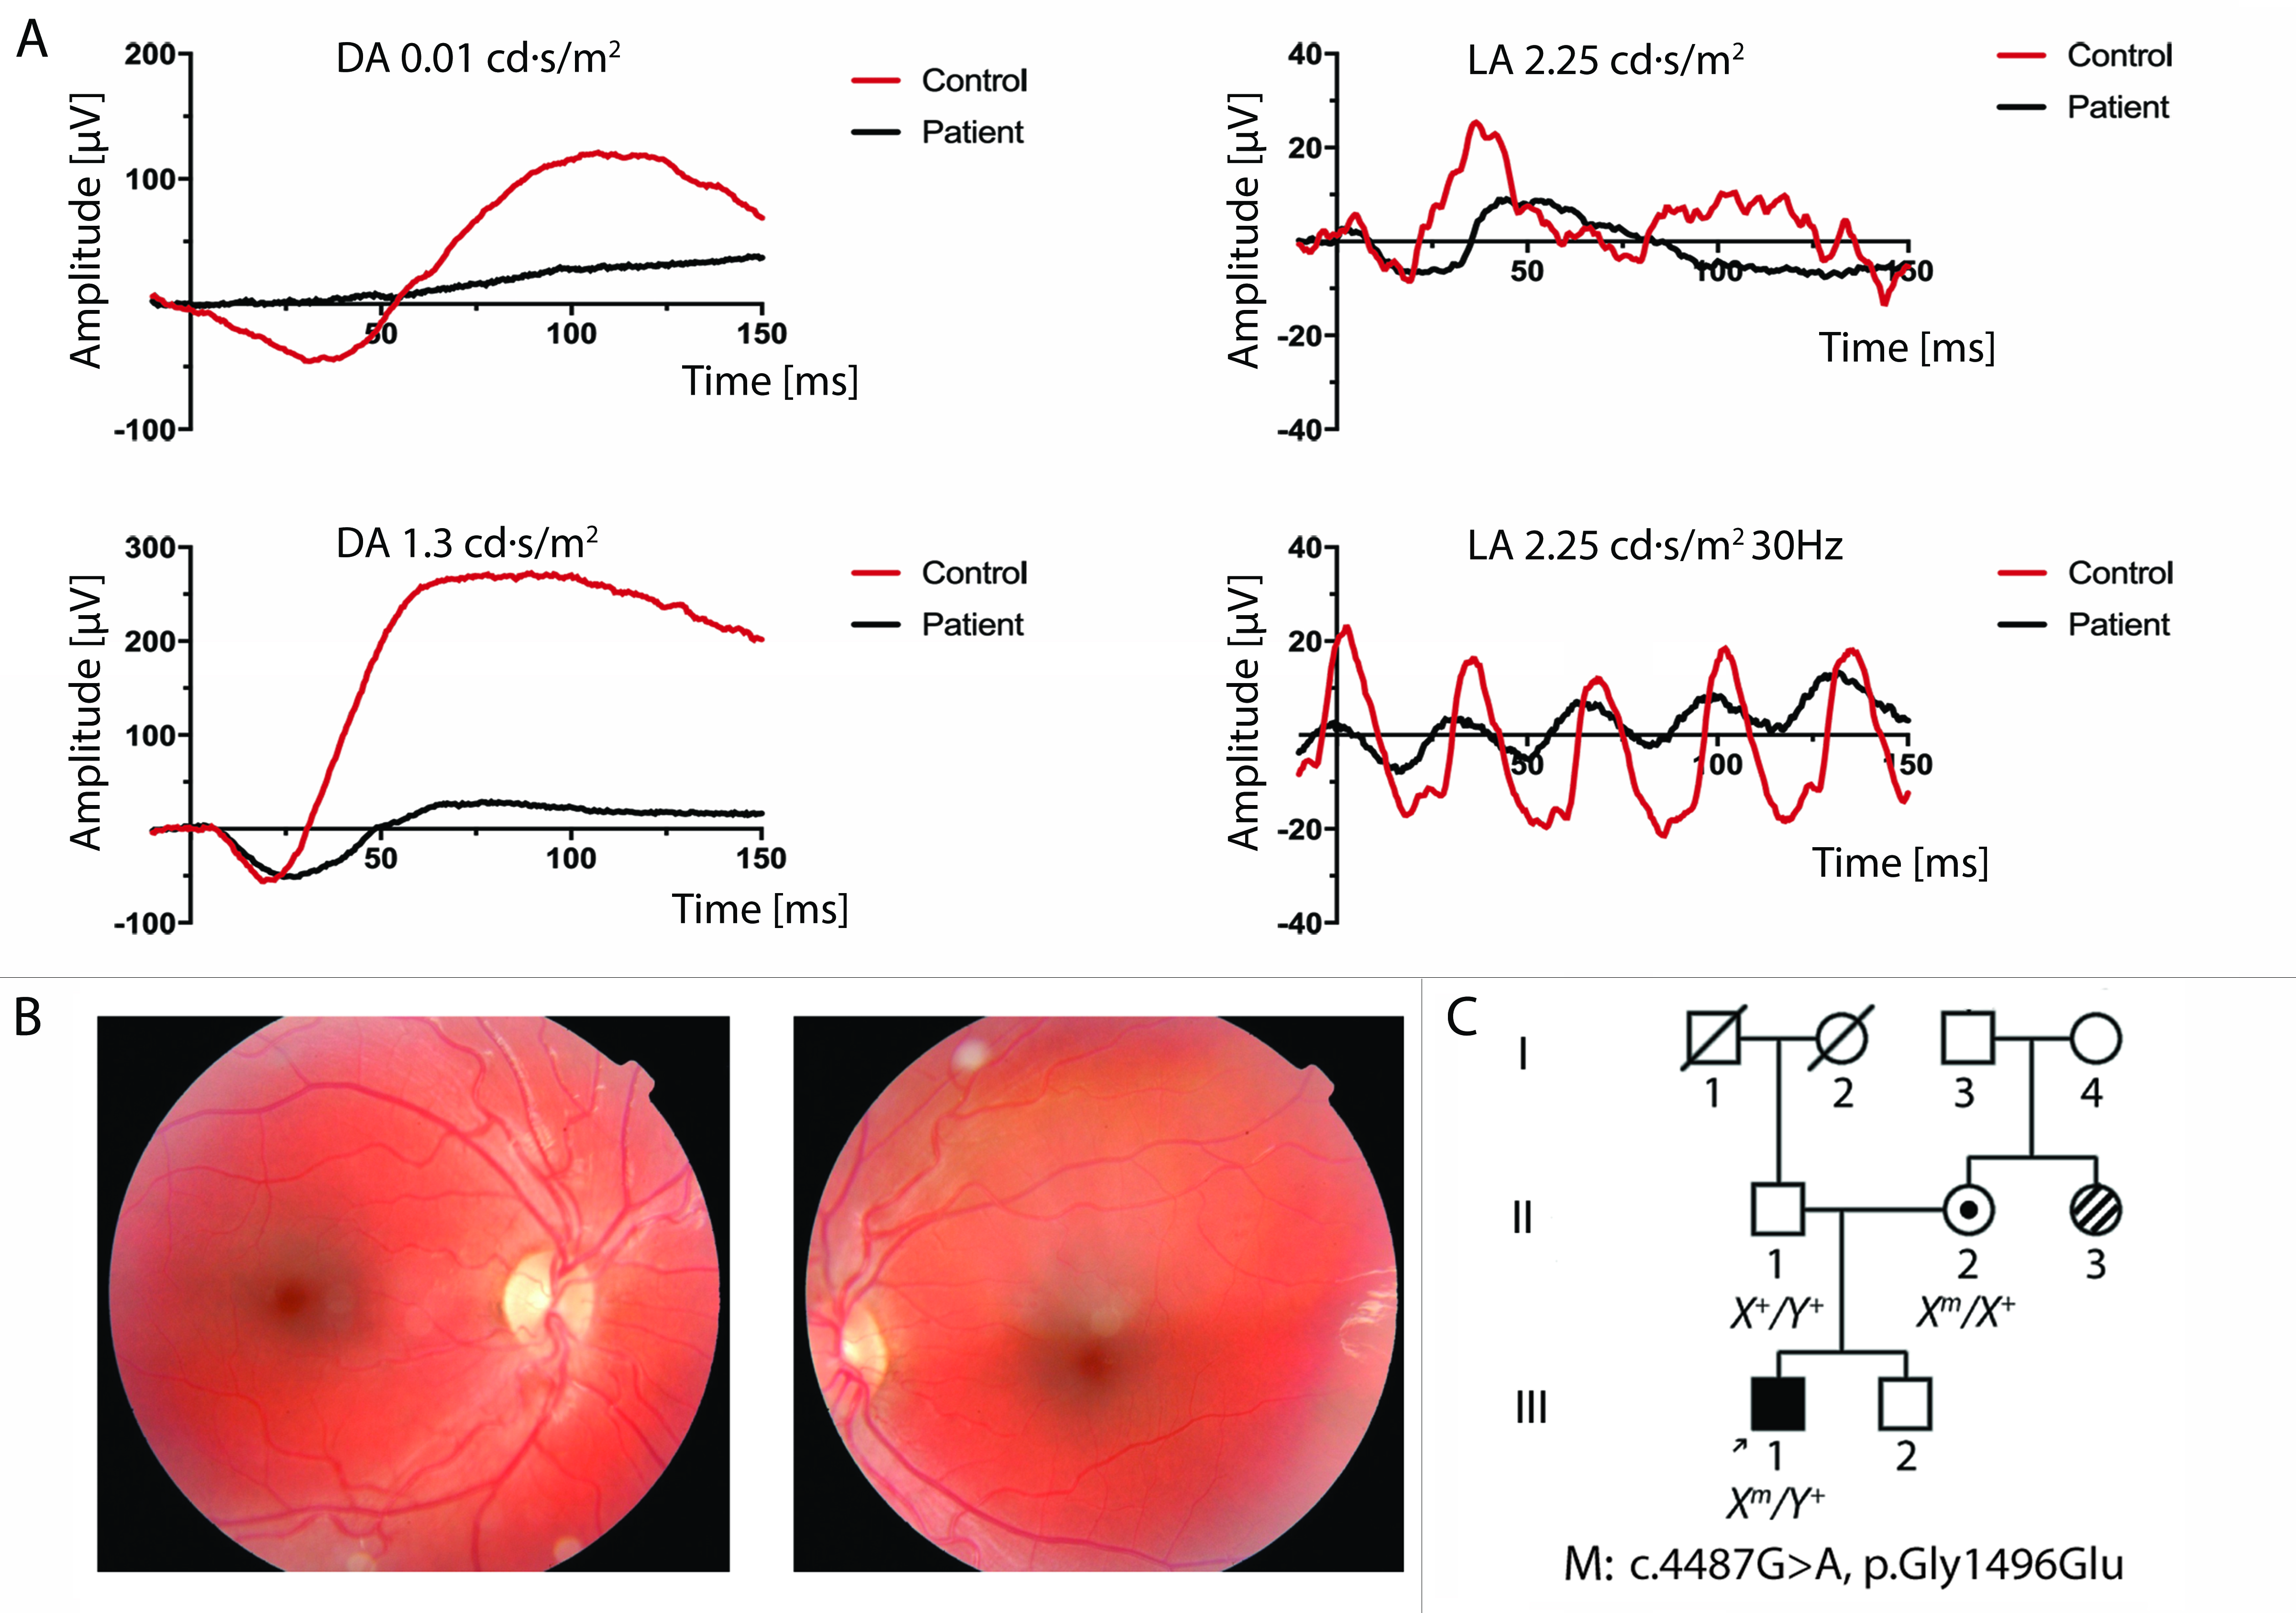
Figure 2. Exam findings for Patient 2.
A: Electroretinograms (ERGs) recorded from Patient 2’s right eye at 5 months old (black traces). Scotopic and photopic responses
closest in flash strength to International Society for Clinical Electrophysiology of Vision (ISCEV) standards are shown. Mixed-response
ERGs at 1.3 cd·s/m
2 are shown instead of at the traditional 3.0 cd·s/m
2 flash strength. Light-adapted ERGs at 2.25 cd·s/m
2 are shown instead of at the traditional 3.0 cd·s/m
2 flash strength. Scotopic ERG testing showed response amplitudes below the 99% prediction interval for normal, with prolonged
b-wave implicit times [
69]. Photopic function was also significantly attenuated, with b-wave responses below the normal mean for his age by two standard
deviations and implicit times prolonged [
70]. The amplitude of the 30-Hz flicker response was 10 µV, about 10% of normal. Control ERGs performed at the same institution
for a healthy 10-month-old are included for comparison (red traces). DA = dark adapted; LA = light adapted.
B: Right and left fundus photographs at age 3 years, showing red foveal areas and increased pigmentation in the parafoveal
area.
C: Family pedigree of Patient 2. Stripes indicate a maternal aunt with Stargardt disease.
 Figure 2 of
Men, Mol Vis 2017; 23:695-706.
Figure 2 of
Men, Mol Vis 2017; 23:695-706.