Figure 5. Transmission electron microscopy of uveal melanoma. A: Uveal melanoma biopsy with nucleus (n), lipid droplets (li), pigment (p), mitocondria (m) and interdigitations (*) between
cells. B–D: In the multicellular tumor spheroids (MCTS), the cells were less packed but contained abundant lipid droplets, pigment,
interdigitations, and a dense concentration of mitochondria. D: Adherence-like junctions (***) between cells were also evident (inset). Scale bars: A, 5 μm; B, 10 μm; C, 1 μm; D, 1 μm.
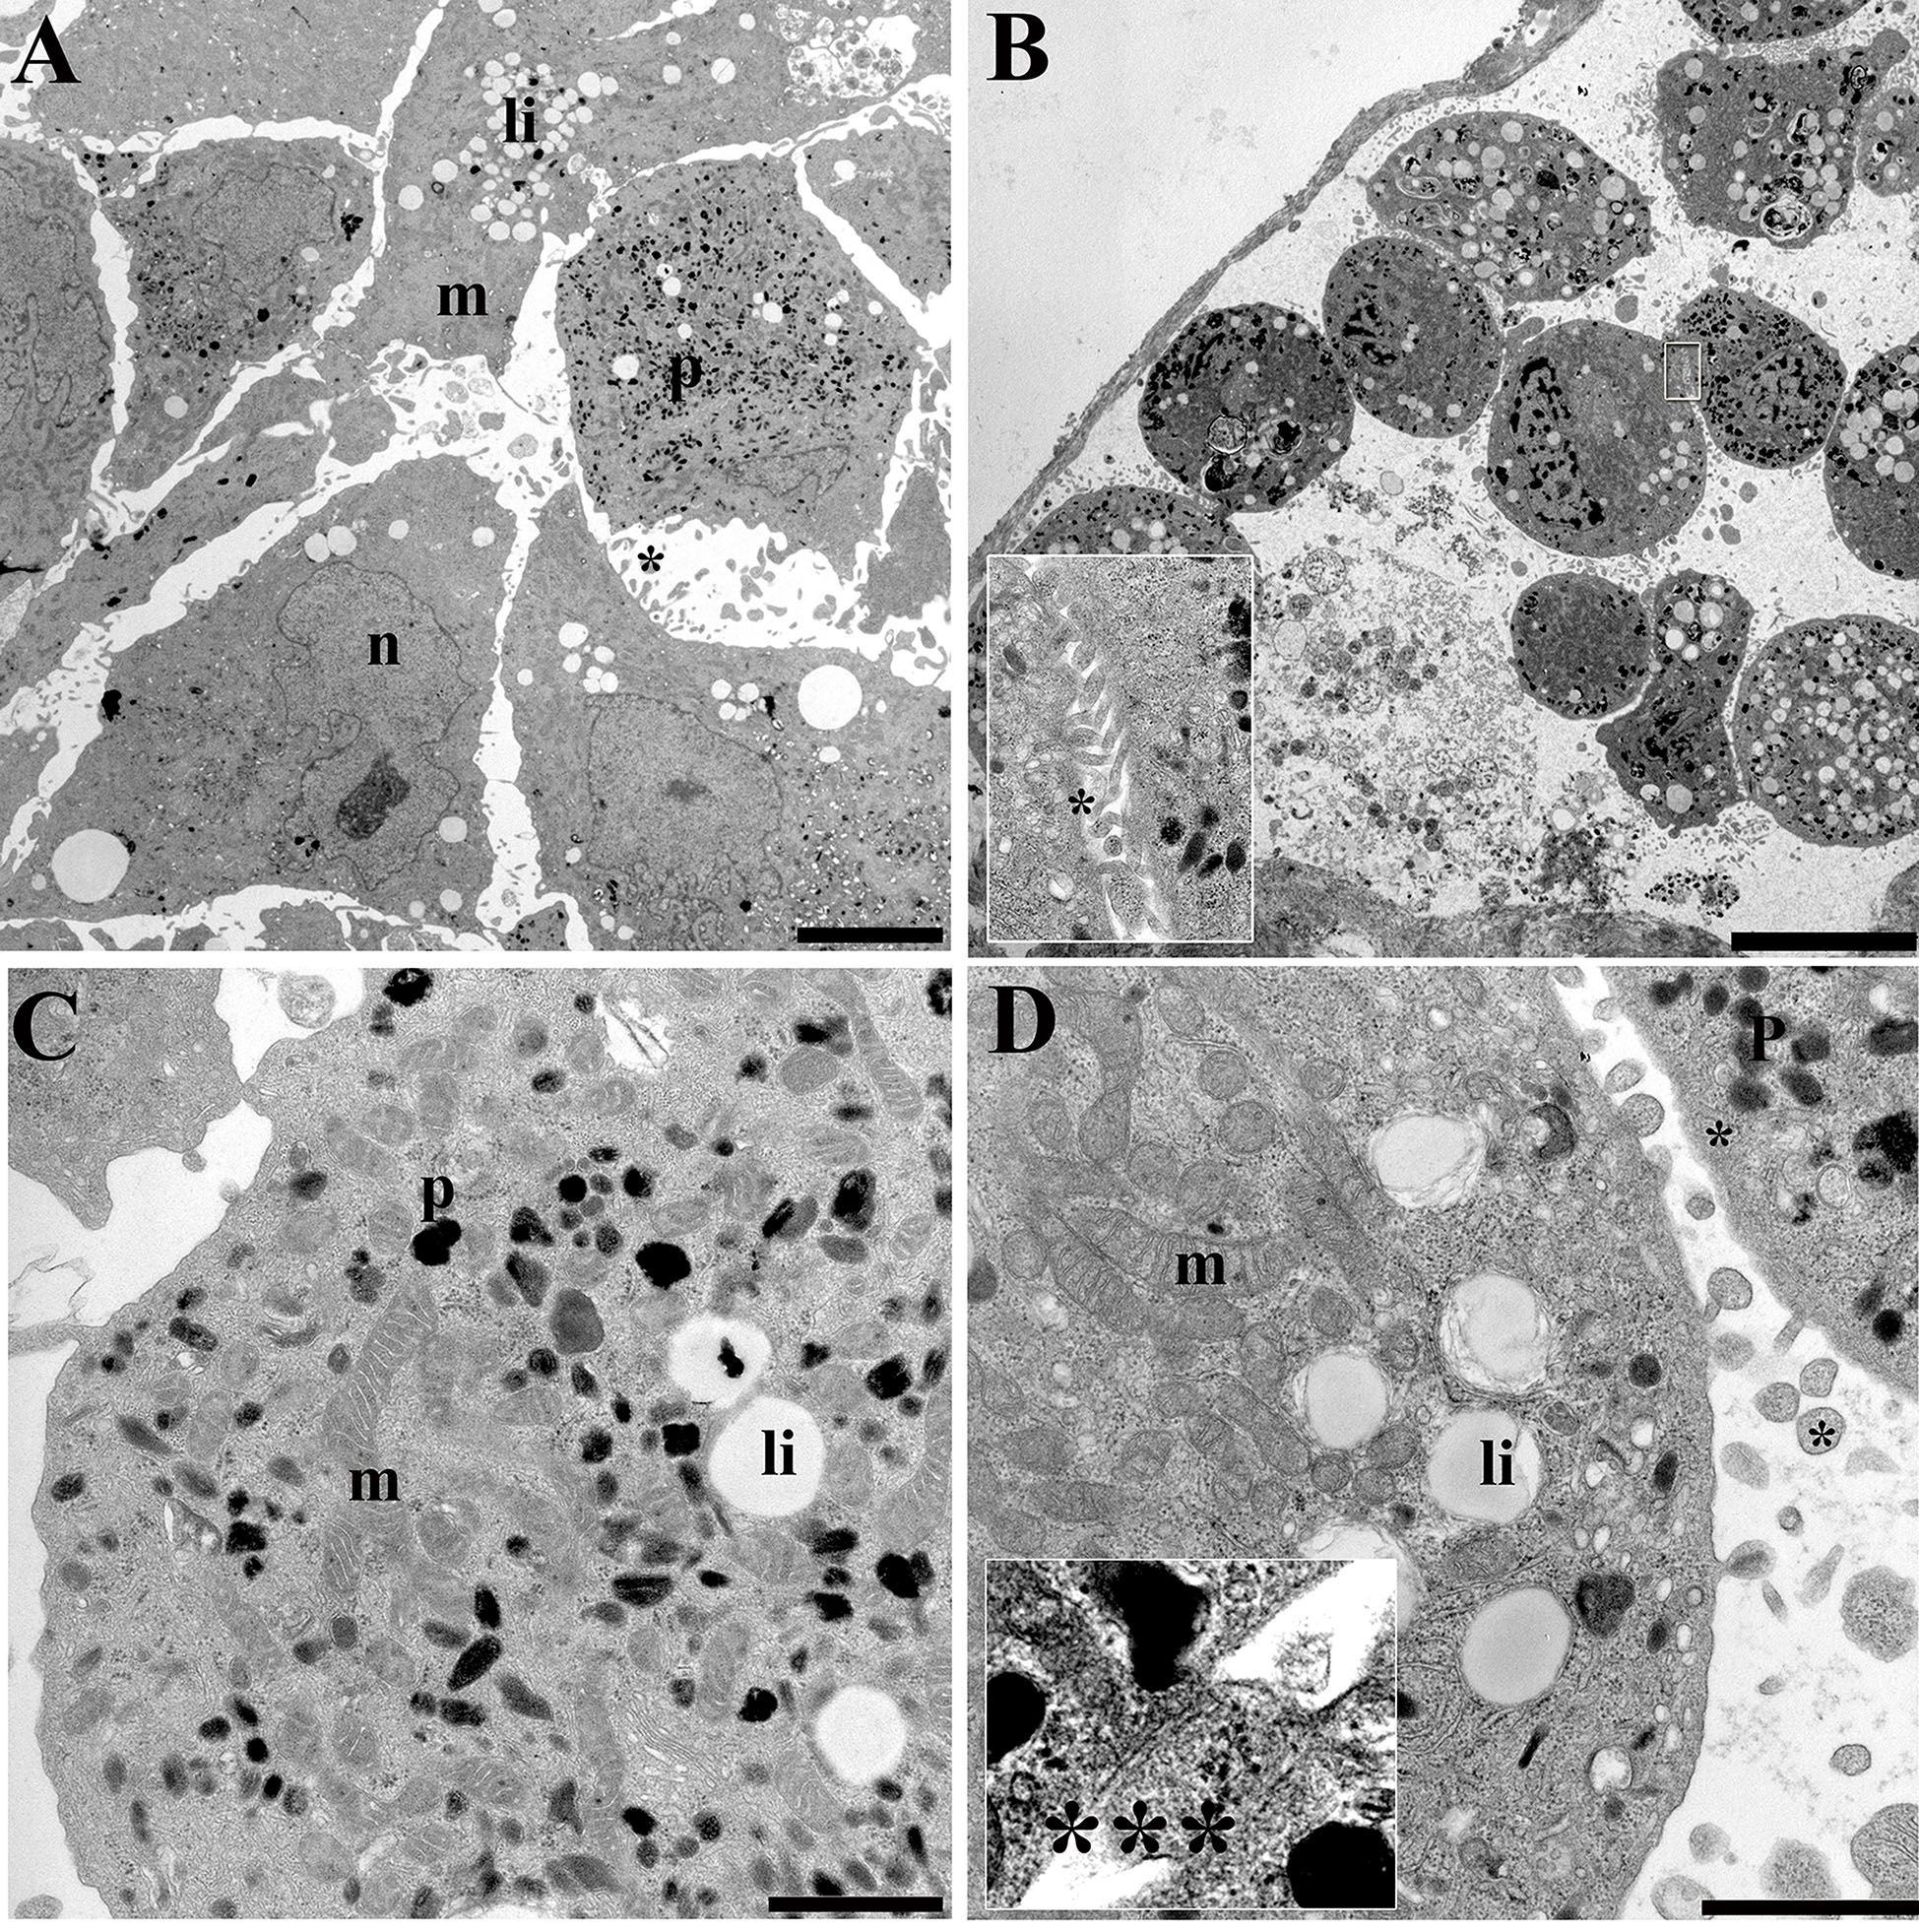
 Figure 5 of
Ness, Mol Vis 2017; 23:680-694.
Figure 5 of
Ness, Mol Vis 2017; 23:680-694.