Figure 4. Lipogenic profile of uveal melanoma multicellular tumor spheroids. Angiopoietin like 4 (ANGPTL4; green) staining of multicellular tumor spheroids (MCTS), Hoechst staining of nucleus (blue; A) with corresponding light-microscopic image (B). Perilipin 2 (PLIN2) staining (green) of MCTS and Hoechst staining of the nucleus (blue; C) with the corresponding light microscopic image (D). E: Quantitative reverse-transcription PCR (qRT-PCR) of ANGPTL4 in support of the microarray finding. F: Ingenuity Pathway Analysis (IPA) based on rank product (q≤0.05) in MCTS versus the tumor, showing important molecules and
pathways, including seven networks and their associated upregulated molecules in lipid metabolism. Deep red indicates more
pronounced expression, and numbers below the gene symbols reflect the fold change (number on top) and q value/significance
(number below).
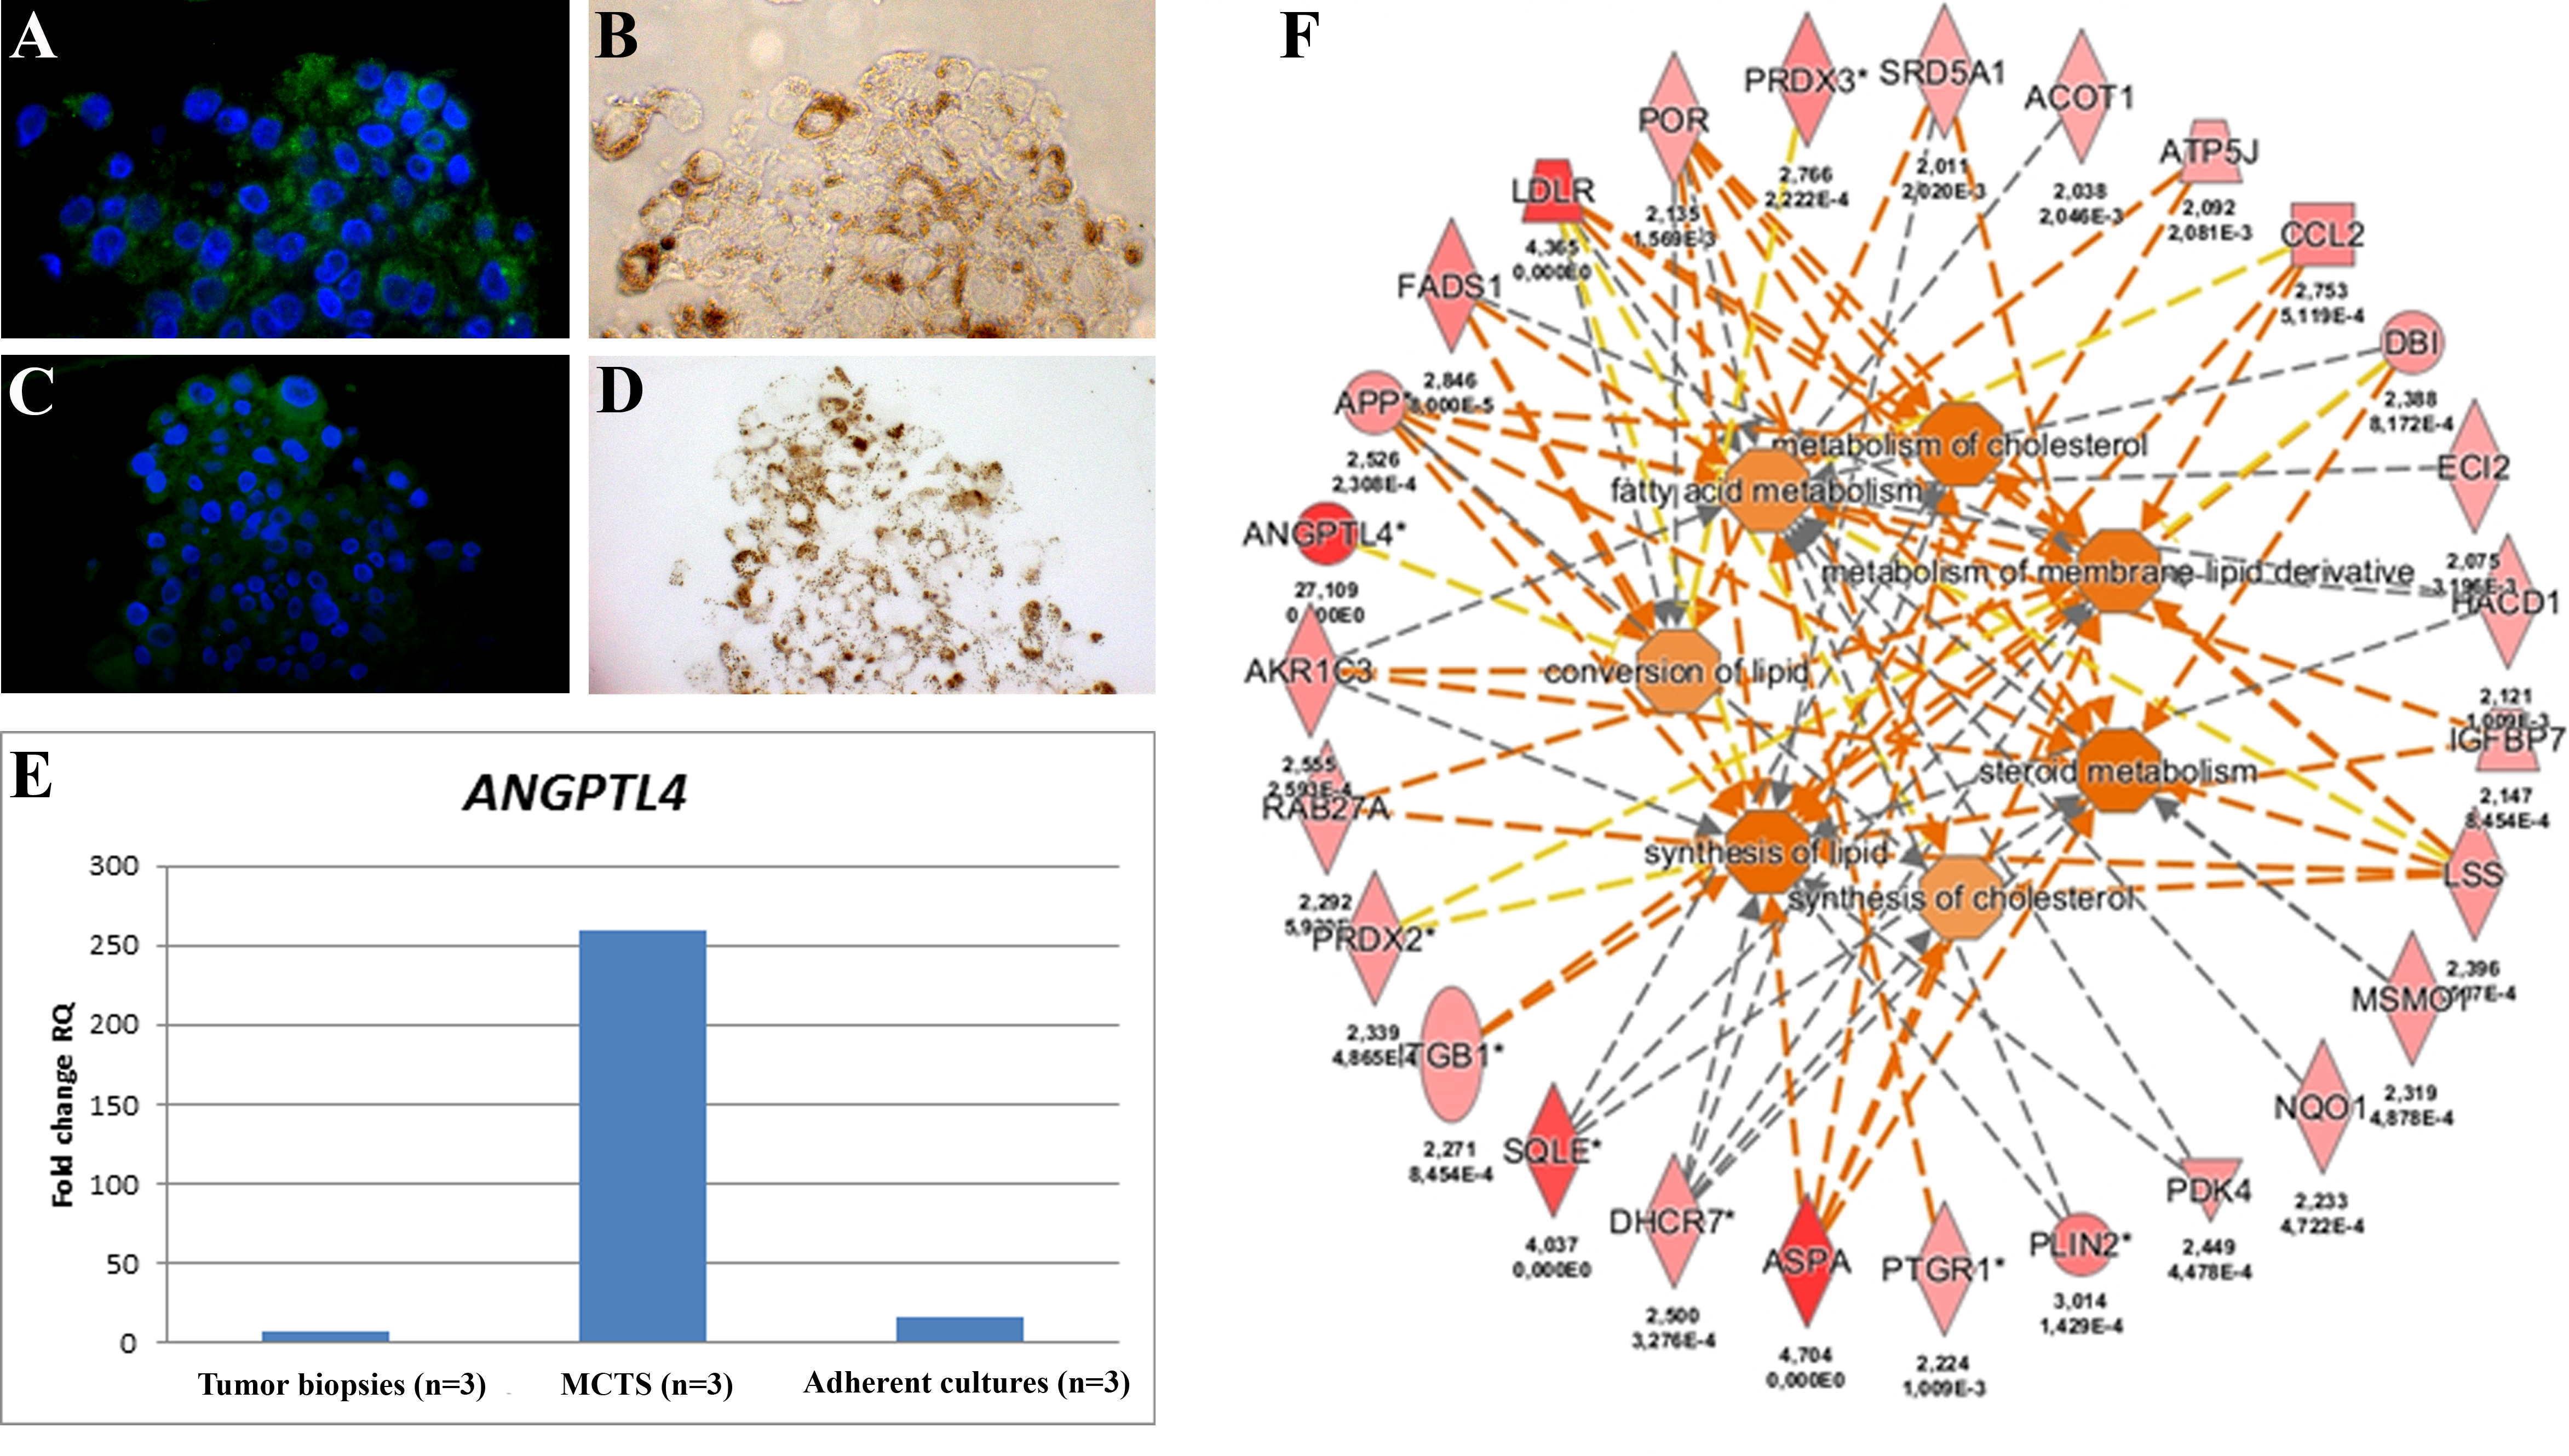
 Figure 4 of
Ness, Mol Vis 2017; 23:680-694.
Figure 4 of
Ness, Mol Vis 2017; 23:680-694.