Figure 2. Gene expression in uveal melanoma donors (D1, D2, and D3) cultured as primary adherent cells (red), multicellular tumor spheroids
(blue), and uncultured tumor biopsies (green). A: Principal component analysis (PCA) plot of gene expression in uveal melanoma donors (D1, D2, and D3) cultured as primary
adherent cells (red), multicellular tumor spheroids (blue), and uncultured tumor biopsies (green). B: Hierarchical clustering of gene expression in uveal melanoma donors (D1, D2, and D3), where each row represents the single
sample tested: adherent cultures (D1, D2, and D3; red), multicellular tumor spheroids (MCTS; D1, D2, and D3; blue), and uncultured
tumors (D1, D2, and D3; green), while each column represents a single probe set (gene symbol or Illumina ID number) analyzed.
Relative gene expression is presented in color: Red is higher-level expression relative to the sample mean, blue is relatively
lower level expression, and gray is no change in expression.
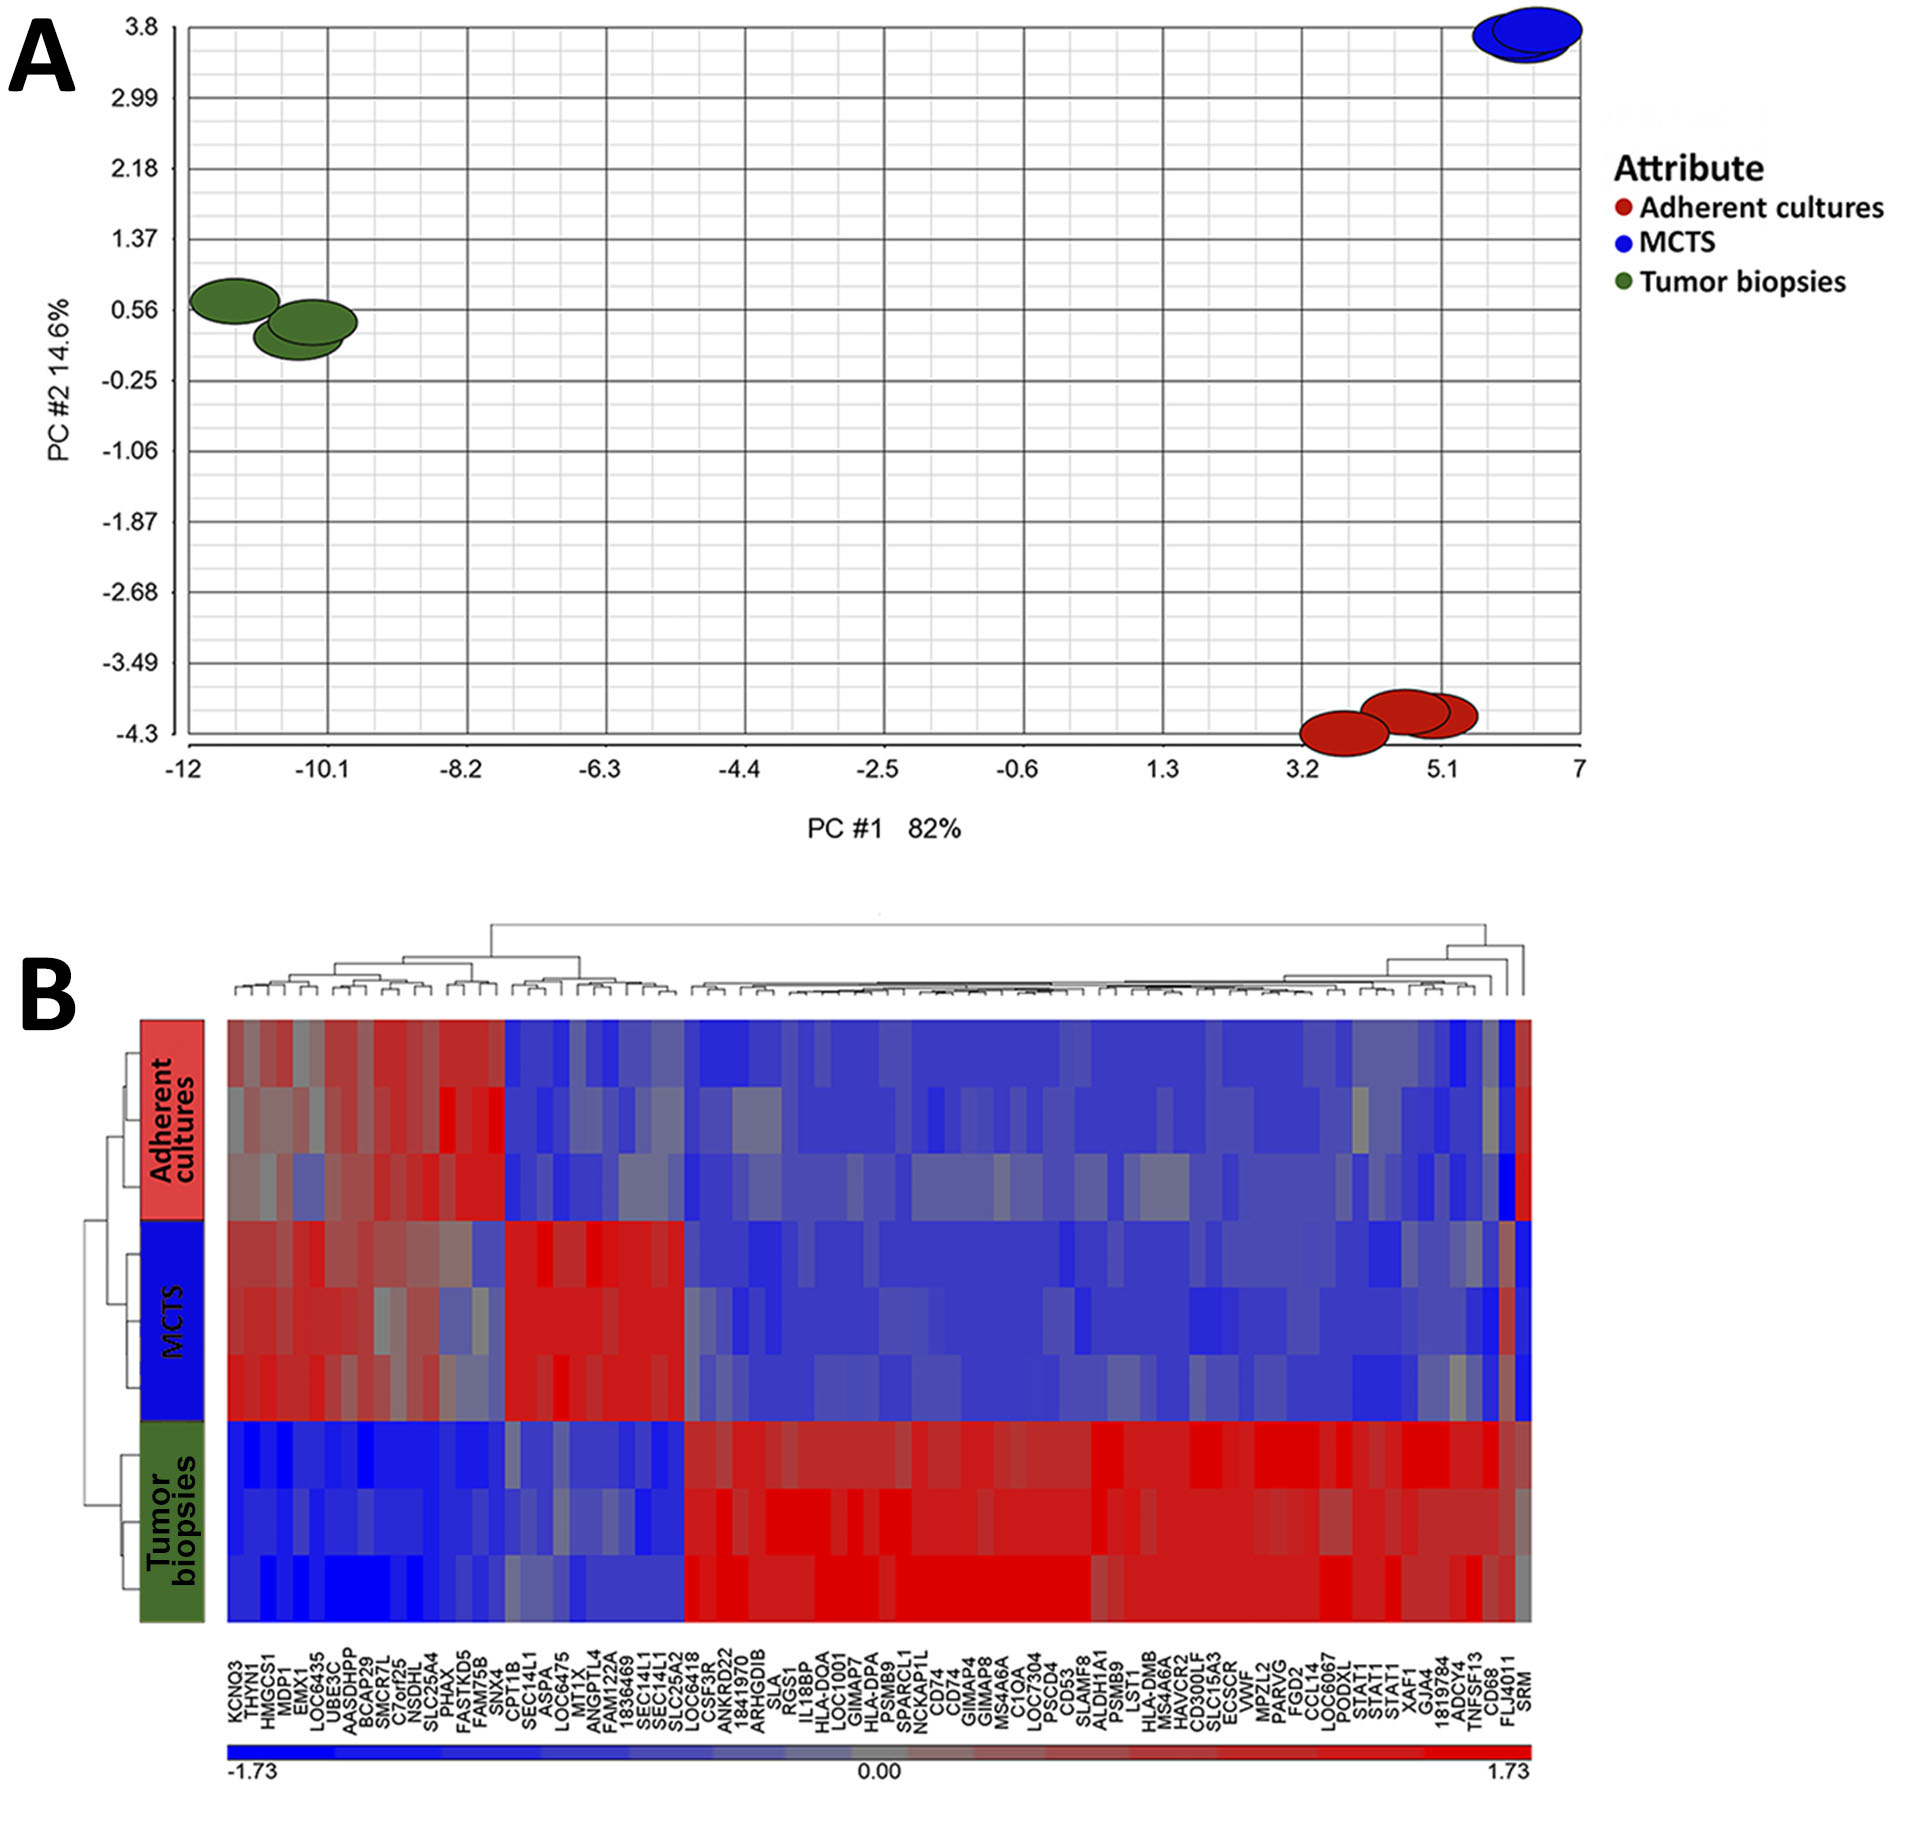
 Figure 2 of
Ness, Mol Vis 2017; 23:680-694.
Figure 2 of
Ness, Mol Vis 2017; 23:680-694.