Figure 5. Levels of D1 and D2 dopamine (DA) receptors in the three groups. A: The number of positive cells in retinal ganglion cells (RGCs). In the FDM group, the numbers of both D1 DA receptors (D1DR)
and D2 DA receptors (D2DR) increased compared with the control group (p<0.05); in the FLM group, the numbers of D1DR and D2DR decreased and increased,
respectively, compared with the control group (both p<0.05). The numbers of RGCs that coexpressed D1DR and D2DR increased
in both the FDM and FLM groups (p<0.05). There were significant differences among the three groups according to the number
of two receptors (p<0.05). B: The average optical density of D1DR-positive cells in inner nuclear layers (INLs) was calculated for the three groups. In
the INLs and IPLs, the quantities of D1DR and D2DR increased in both the FDM and FLM groups (FLM: flickering light (FL)-induced
myopia, FDM: form-deprivation myopia; p<0.05 versus control group), and significant differences were detected among the three
groups (p<0.05). C: The average optical density of D2DR-positive cells in the inner plexiform layers (IPL) was calculated for the three groups
(*p<0.05 versus control group; #p<0.05 versus FDM group; data are presented as mean ± standard error of the mean [SEM]).
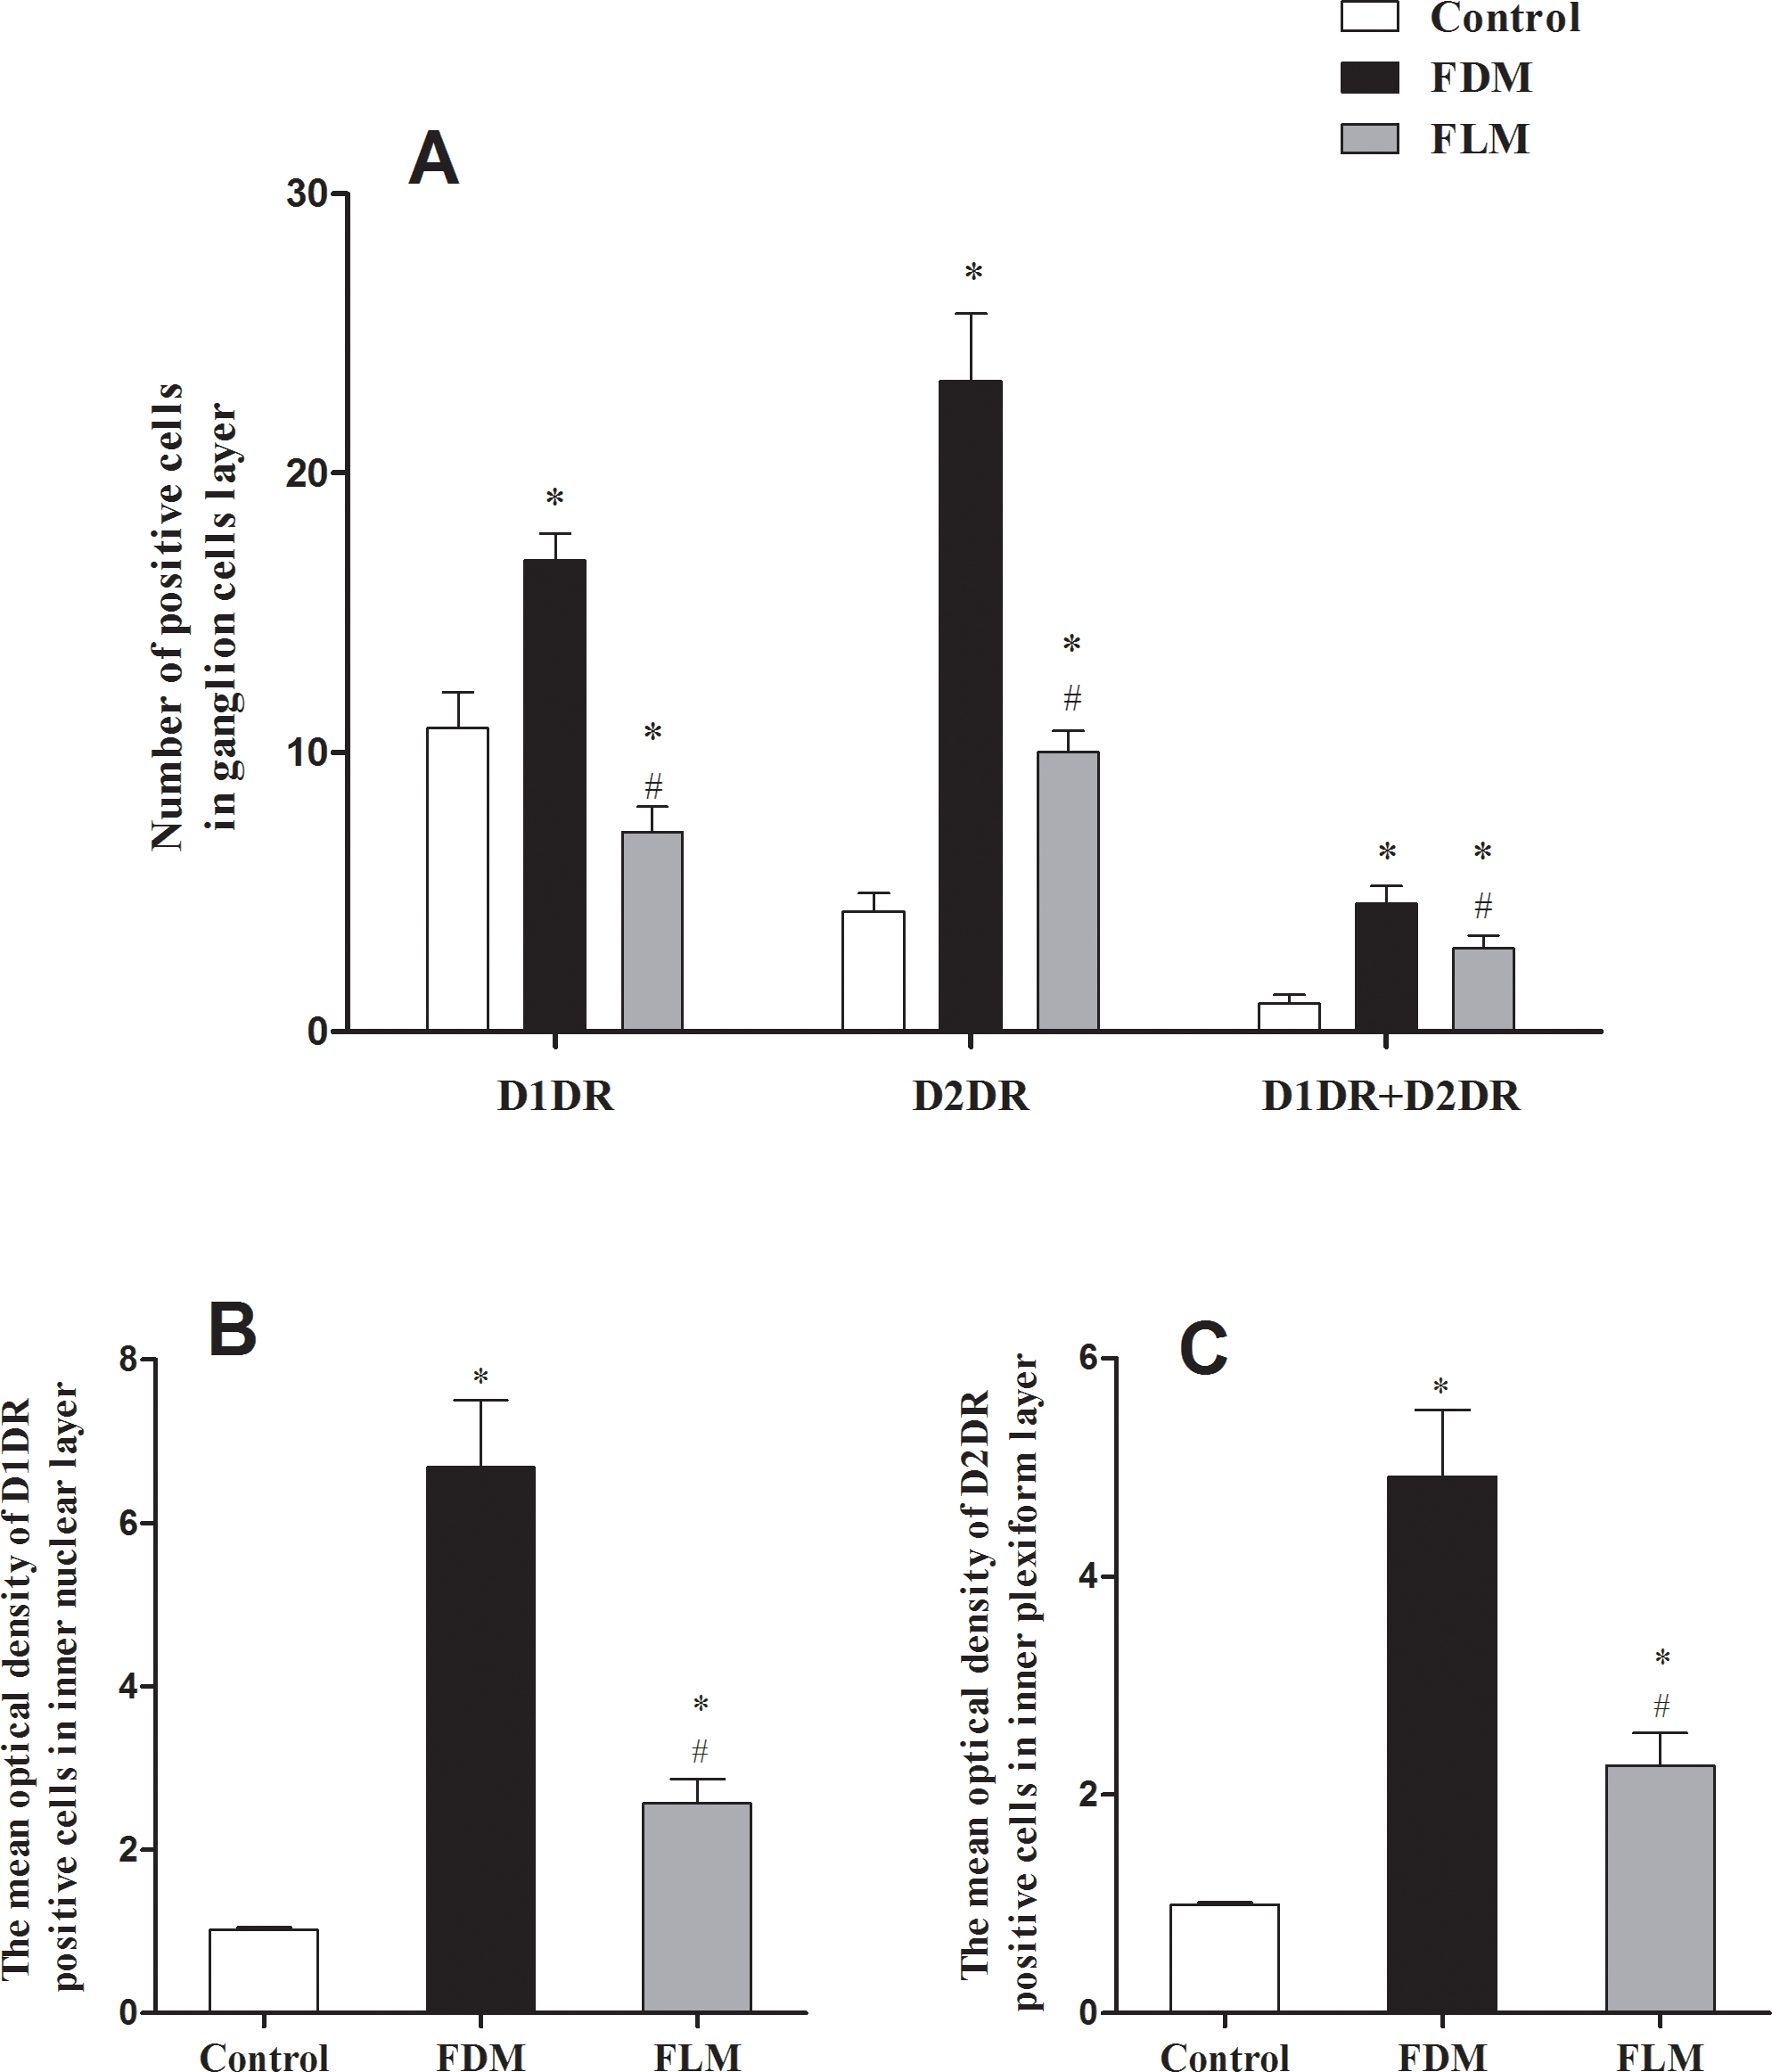
 Figure 5 of
Luo, Mol Vis 2017; 23:666-679.
Figure 5 of
Luo, Mol Vis 2017; 23:666-679.