Figure 3. Levels of DA, DOPAC, and HVA in the eyes of the three groups after the 8-week experiment. A: Retinal levels of DA, DOPAC, and HVA increased in the FLM group but decreased in the FDM group compared with controls (p<0.05).
B: Expression of these substances in the vitreous body was comparable to their trends in the retina, whereas the vitreal DOPAC
level in the FLM group showed no significant difference compared with that in the control group (p>0.05) and showed a significant
difference compared with that in the FDM group (p<0.05). C: Levels of DA and its two metabolites in the RPE were significantly increased in the FDM and FLM eyes compared with control
eyes (p<0.05; FLM: flickering light (FL)-induced myopia, FDM: form-deprivation myopia, DA: dopamine, DOPAC: 3,4-dihydroxyphenylacetic
acid, HVA: homovanillic acid. *p<0.05 versus control group; #p<0.05 versus FDM group; data are presented as mean ± standard
error of the mean [SEM]).
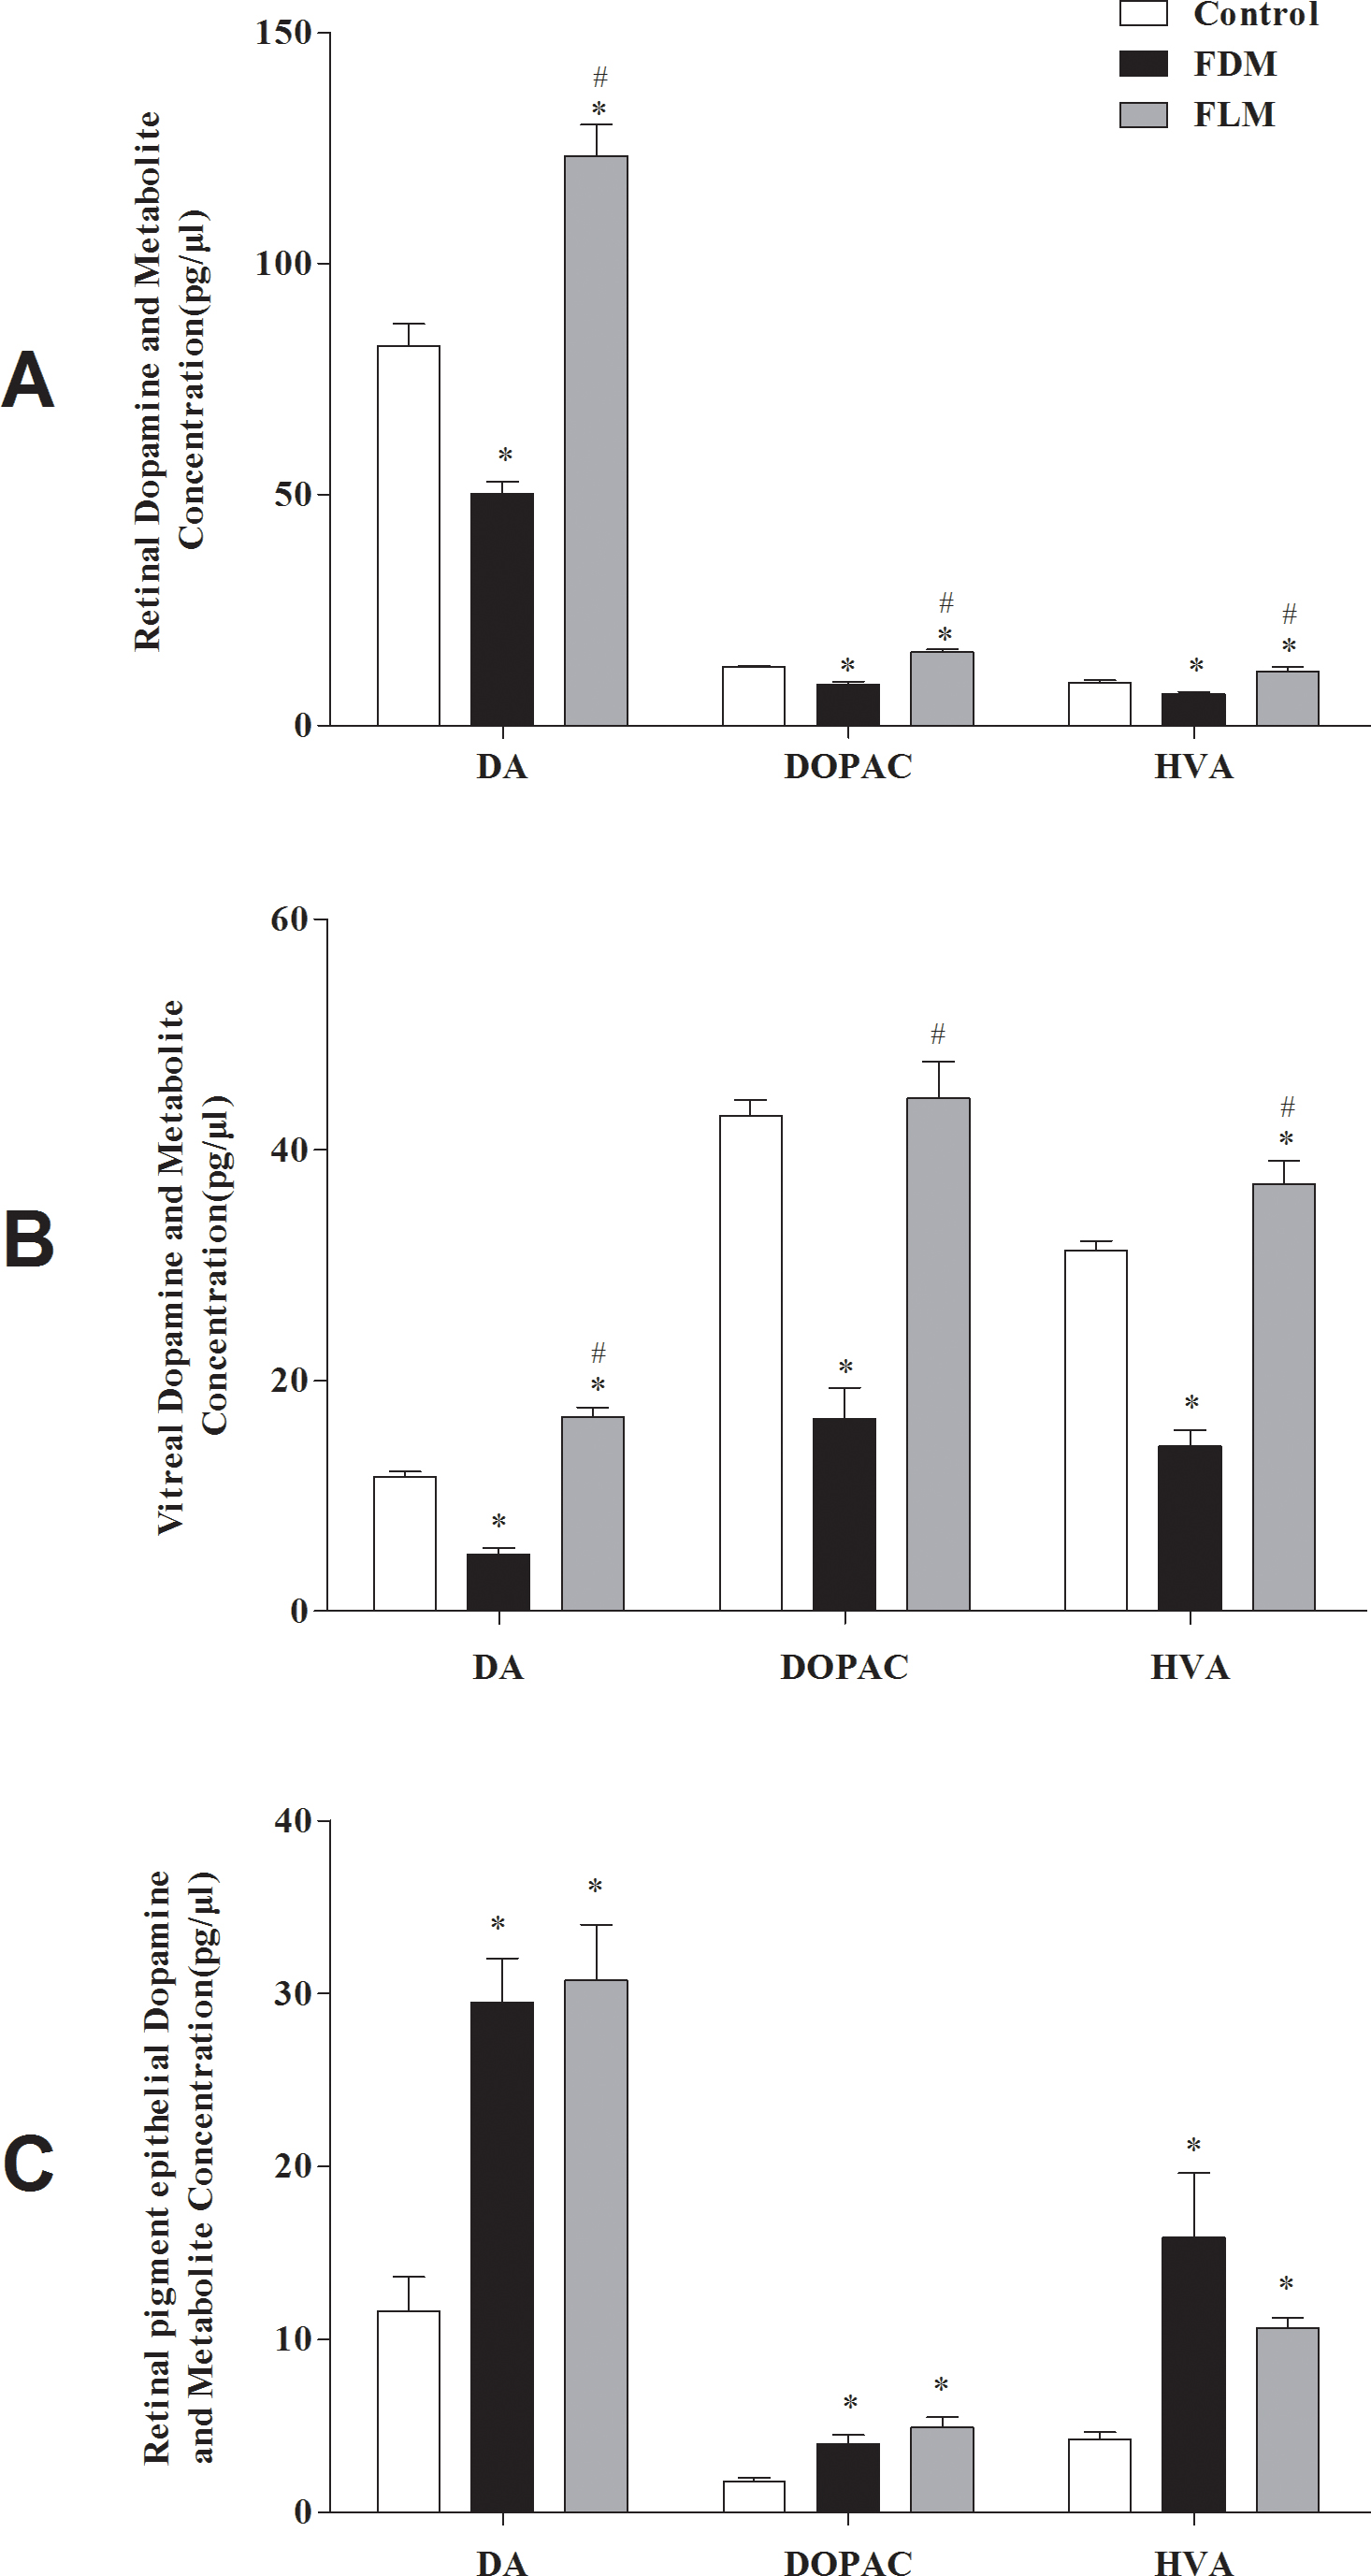
 Figure 3 of
Luo, Mol Vis 2017; 23:666-679.
Figure 3 of
Luo, Mol Vis 2017; 23:666-679.