Figure 2. Comparisons of AL and CRC among the right eyes of the control, FLM, and FDM groups during the 8-week treatment period. A: ALs of the right eyes in the three groups throughout the experimental period. B: AL alterations of the right eyes in the three experimental groups after 8 weeks of treatment. C: CRCs of the right eyes in the three groups throughout the experiment. D: CRC changes of the right eyes in the three experimental groups after 8 weeks of treatment (FLM: flickering light (FL)-induced
myopia, FDM: form-deprivation myopia, AL: axial length, CRC: corneal radius of curvature. *p<0.05 versus control group; **p<0.01
versus control group; #p<0.05 versus FDM group; ##p<0.01 versus FDM group; data are shown as mean ± standard error of the mean [SEM]).
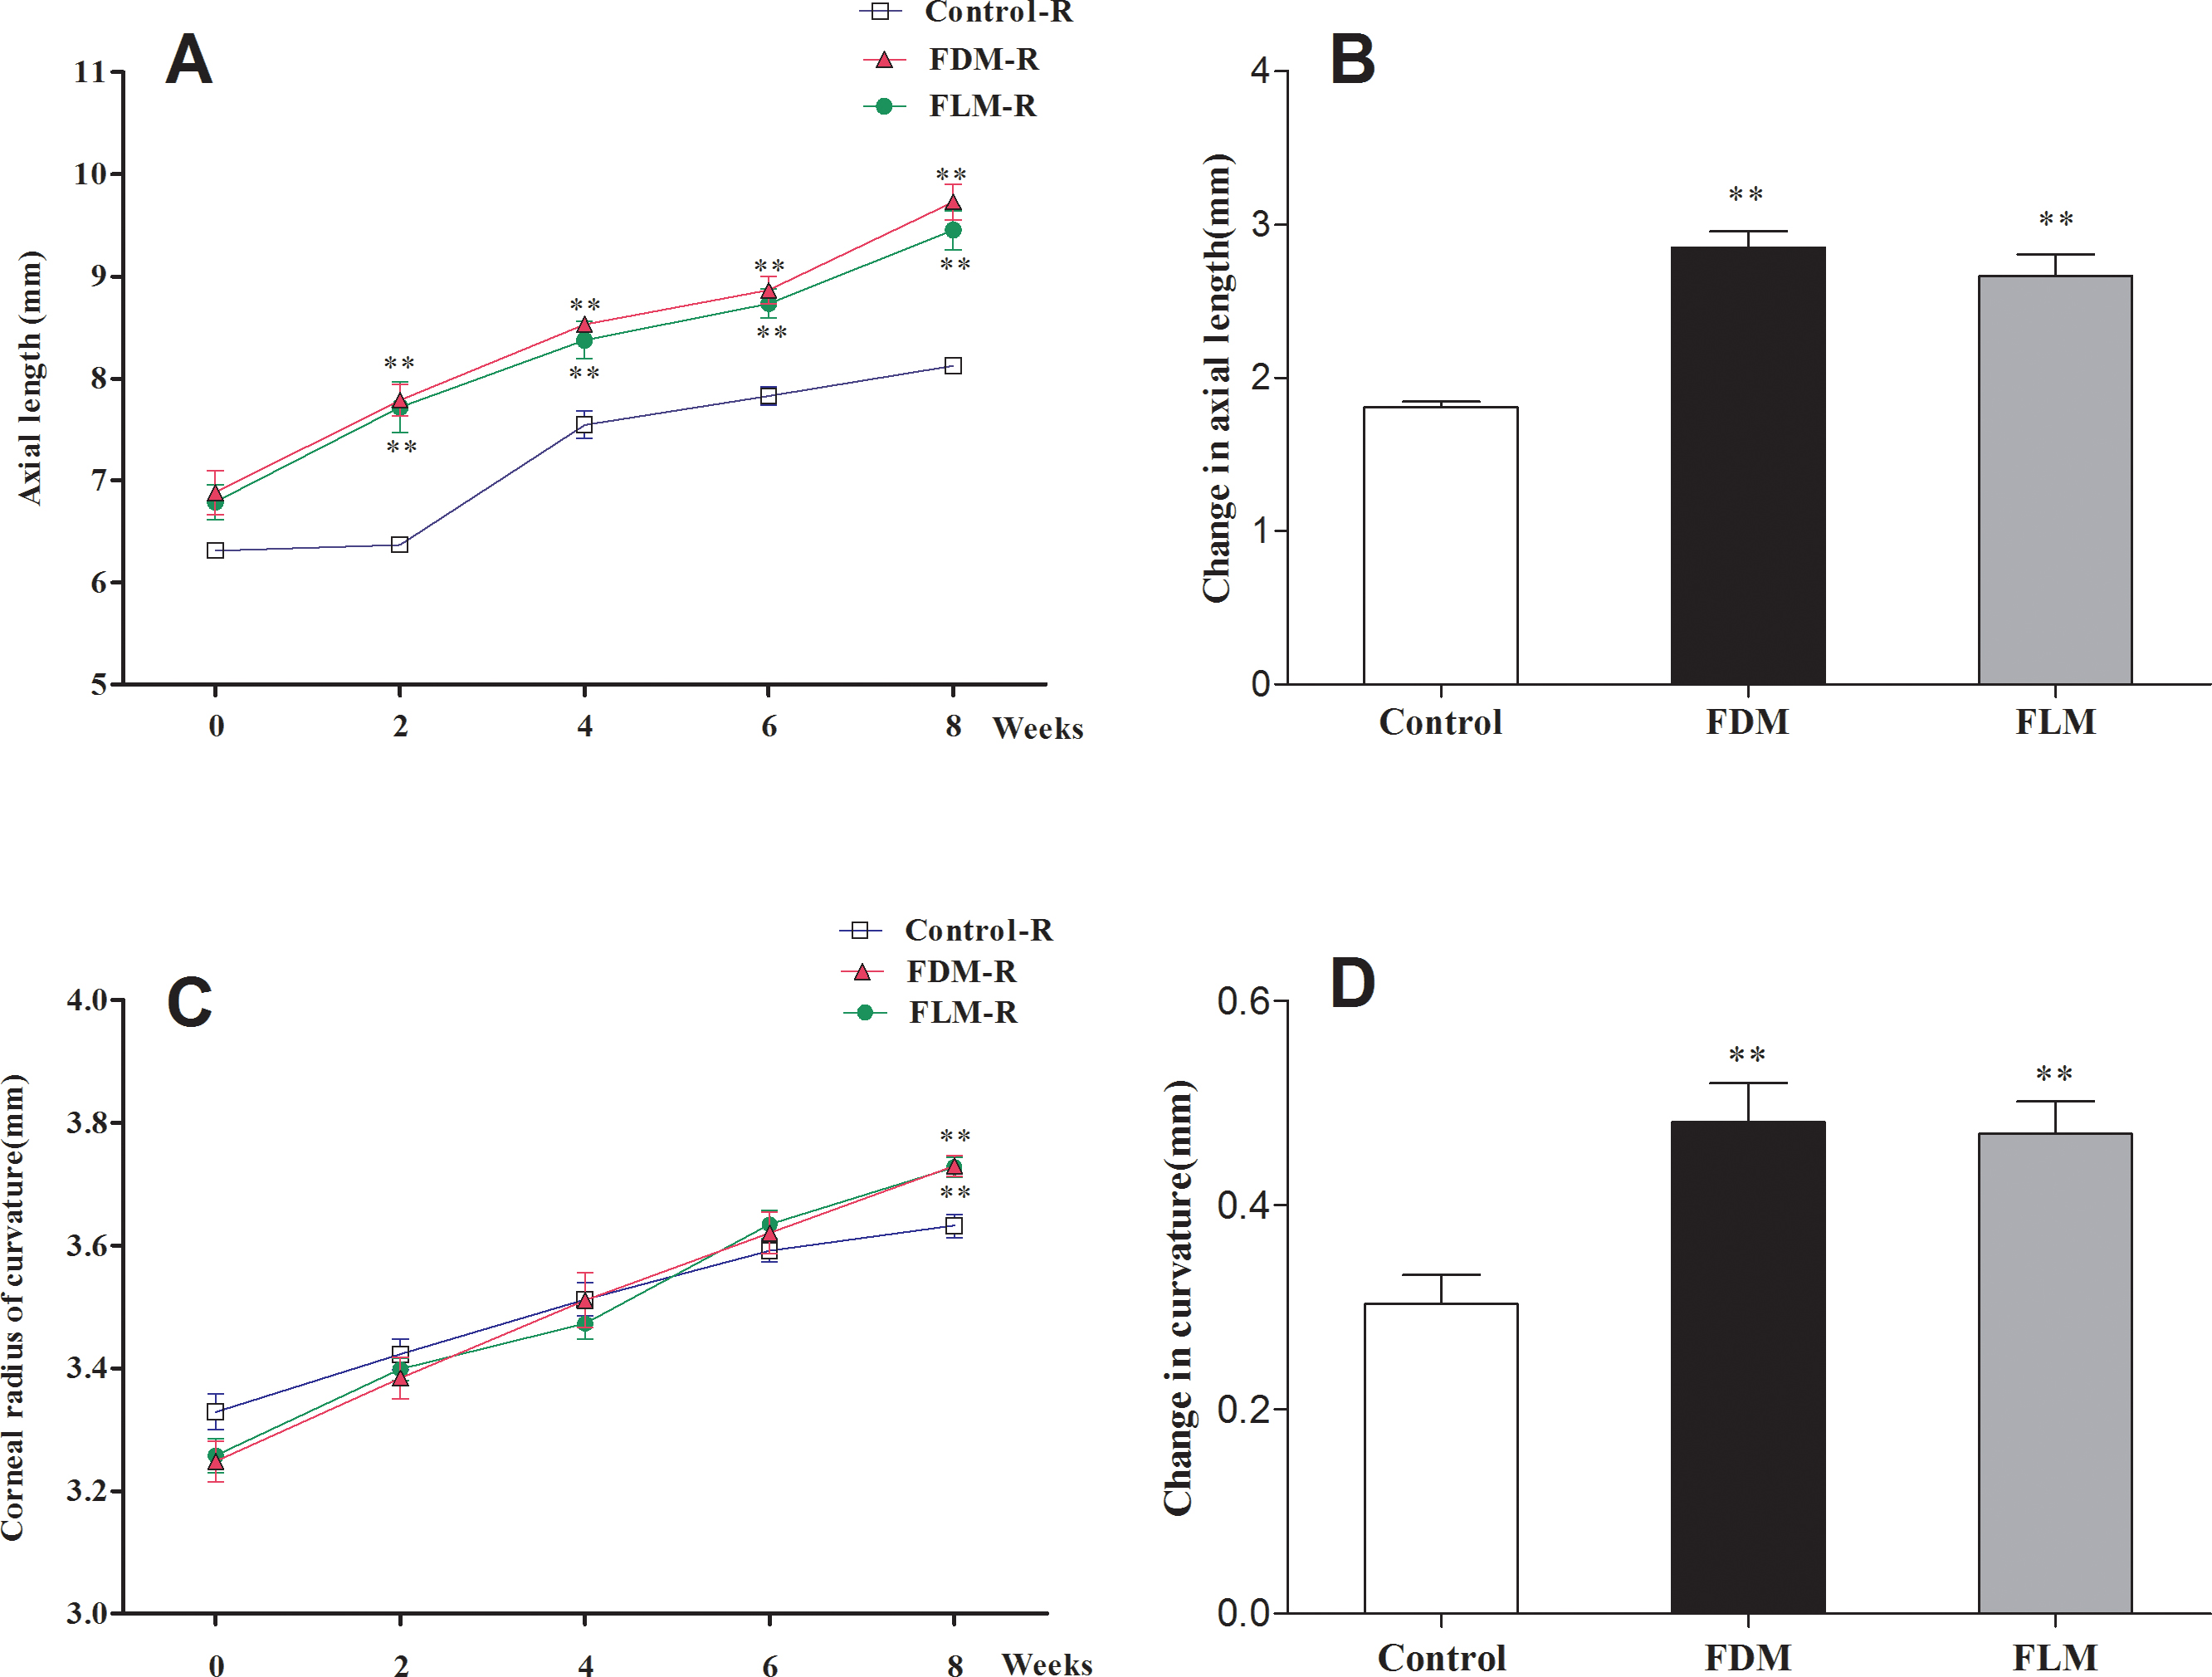
 Figure 2 of
Luo, Mol Vis 2017; 23:666-679.
Figure 2 of
Luo, Mol Vis 2017; 23:666-679.