Figure 1. Refractive comparisons in bilateral eyes of the control, FLM, and FDM groups during the 8-week treatment period. A: Refraction of the right eyes in the three groups throughout the experiment. B: Refractive changes of the right eyes in the three groups after 8 weeks of treatment. C: Refraction of the left eyes in the three groups throughout the experiment. D: Refractive changes of the left eyes in the three groups after 8 weeks of treatment. The calculation of change was based
on the refraction measured at the end of week 8 minus that obtained at week 0. Similar calculations were applied for AL and
CRC measurement (FLM: flickering light (FL)-induced myopia, FDM: form-deprivation myopia, AL: axial length, CRC: corneal radius
of curvature. *p<0.05 versus control group (n=15 for each group); **p<0.01 versus control group; #p<0.05 versus FDM group; ##p<0.01 versus FDM group; data are expressed as mean ± standard error of the mean [SEM]).
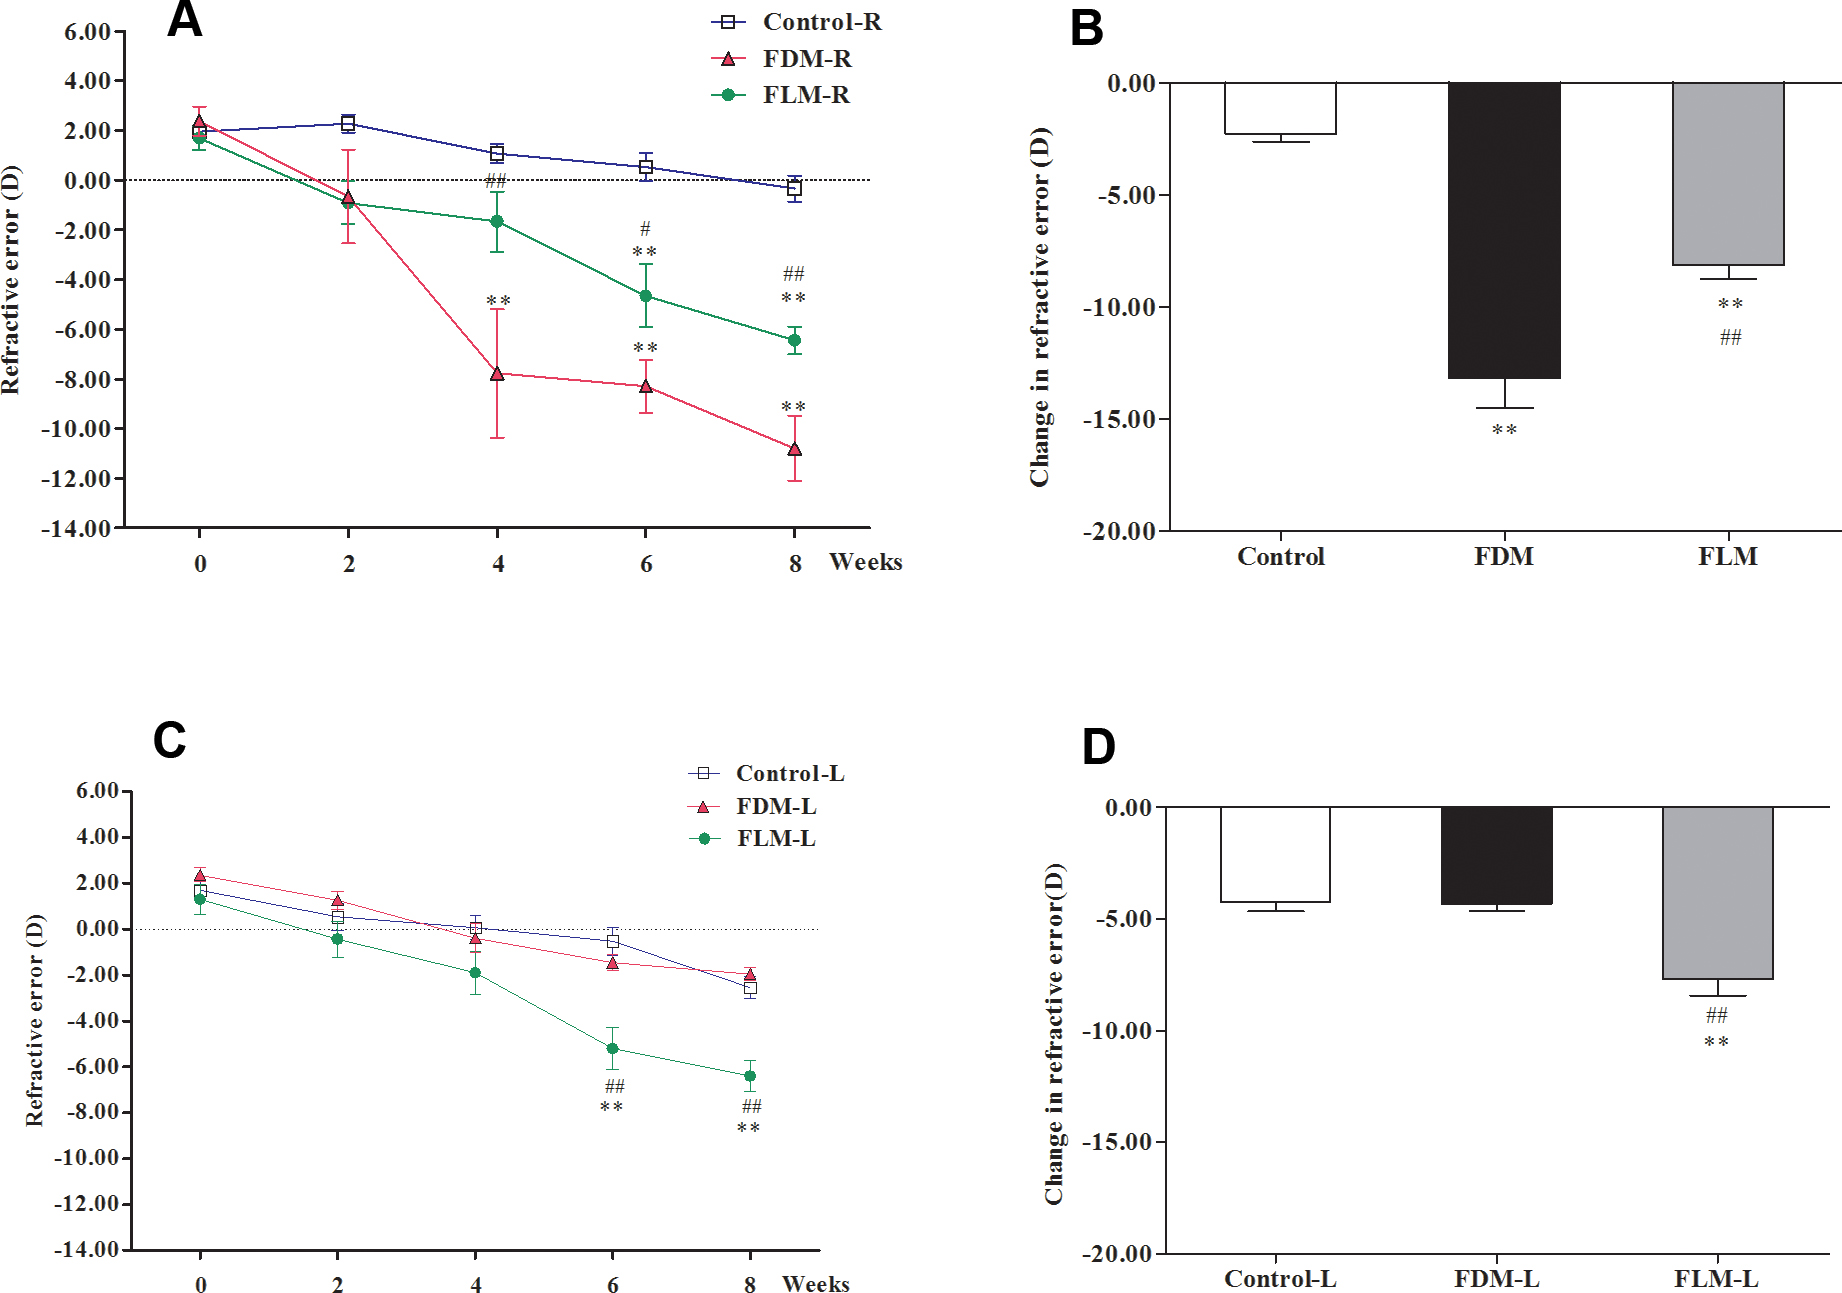
 Figure 1 of
Luo, Mol Vis 2017; 23:666-679.
Figure 1 of
Luo, Mol Vis 2017; 23:666-679.