Figure 2. mRNA expression of αA-crystalline, filensin, and phakinin. mRNA levels were analyzed with comparative real-time PCR and normalized
to GAPDH. Each value represents mean ± standard deviation (SD) of three independent experiments (n=7). #p<0.05, ##p<0.01 statistically
significant different from group 1. *p<0.05 statistically significant different from group 2. αA-CRY: αA-crystalline. Group
1: normal control, Group 2: selenite-treated, Group 3: selenite/curcumin-treated (80 mg/kg), Groups 4 to 6: selenite/Pinus densiflora bark extract-treated (40, 80, and 120 mg/kg, respectively) animals.
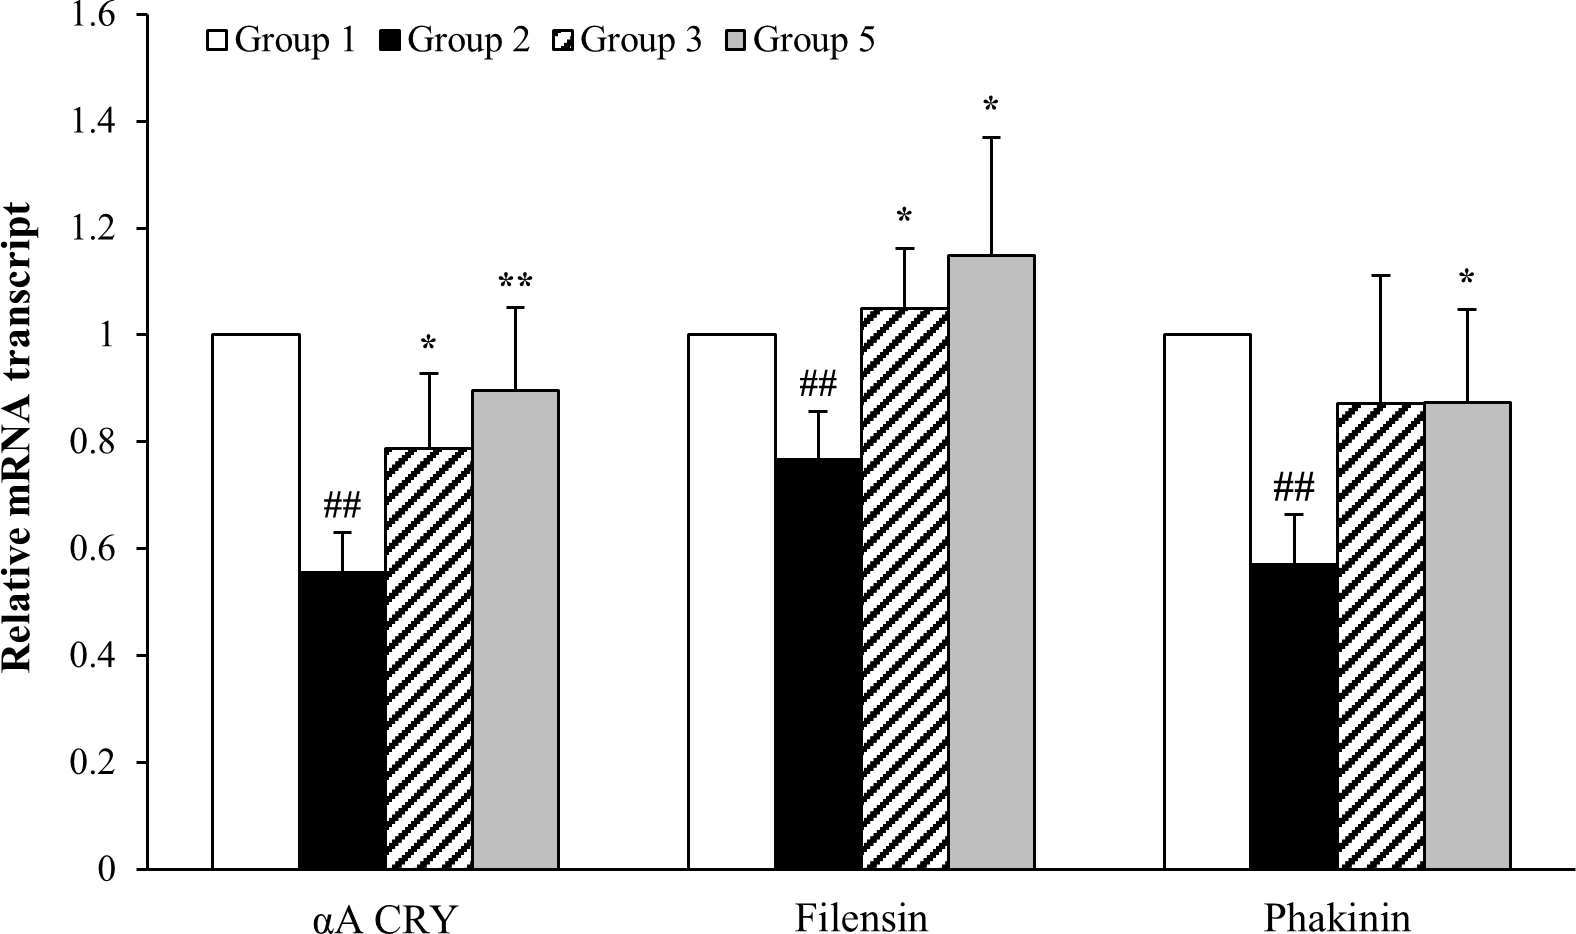
 Figure 2 of
Kim, Mol Vis 2017; 23:638-648.
Figure 2 of
Kim, Mol Vis 2017; 23:638-648.