Figure 1 of
Huang, Mol Vis 2017; 23:605-613.
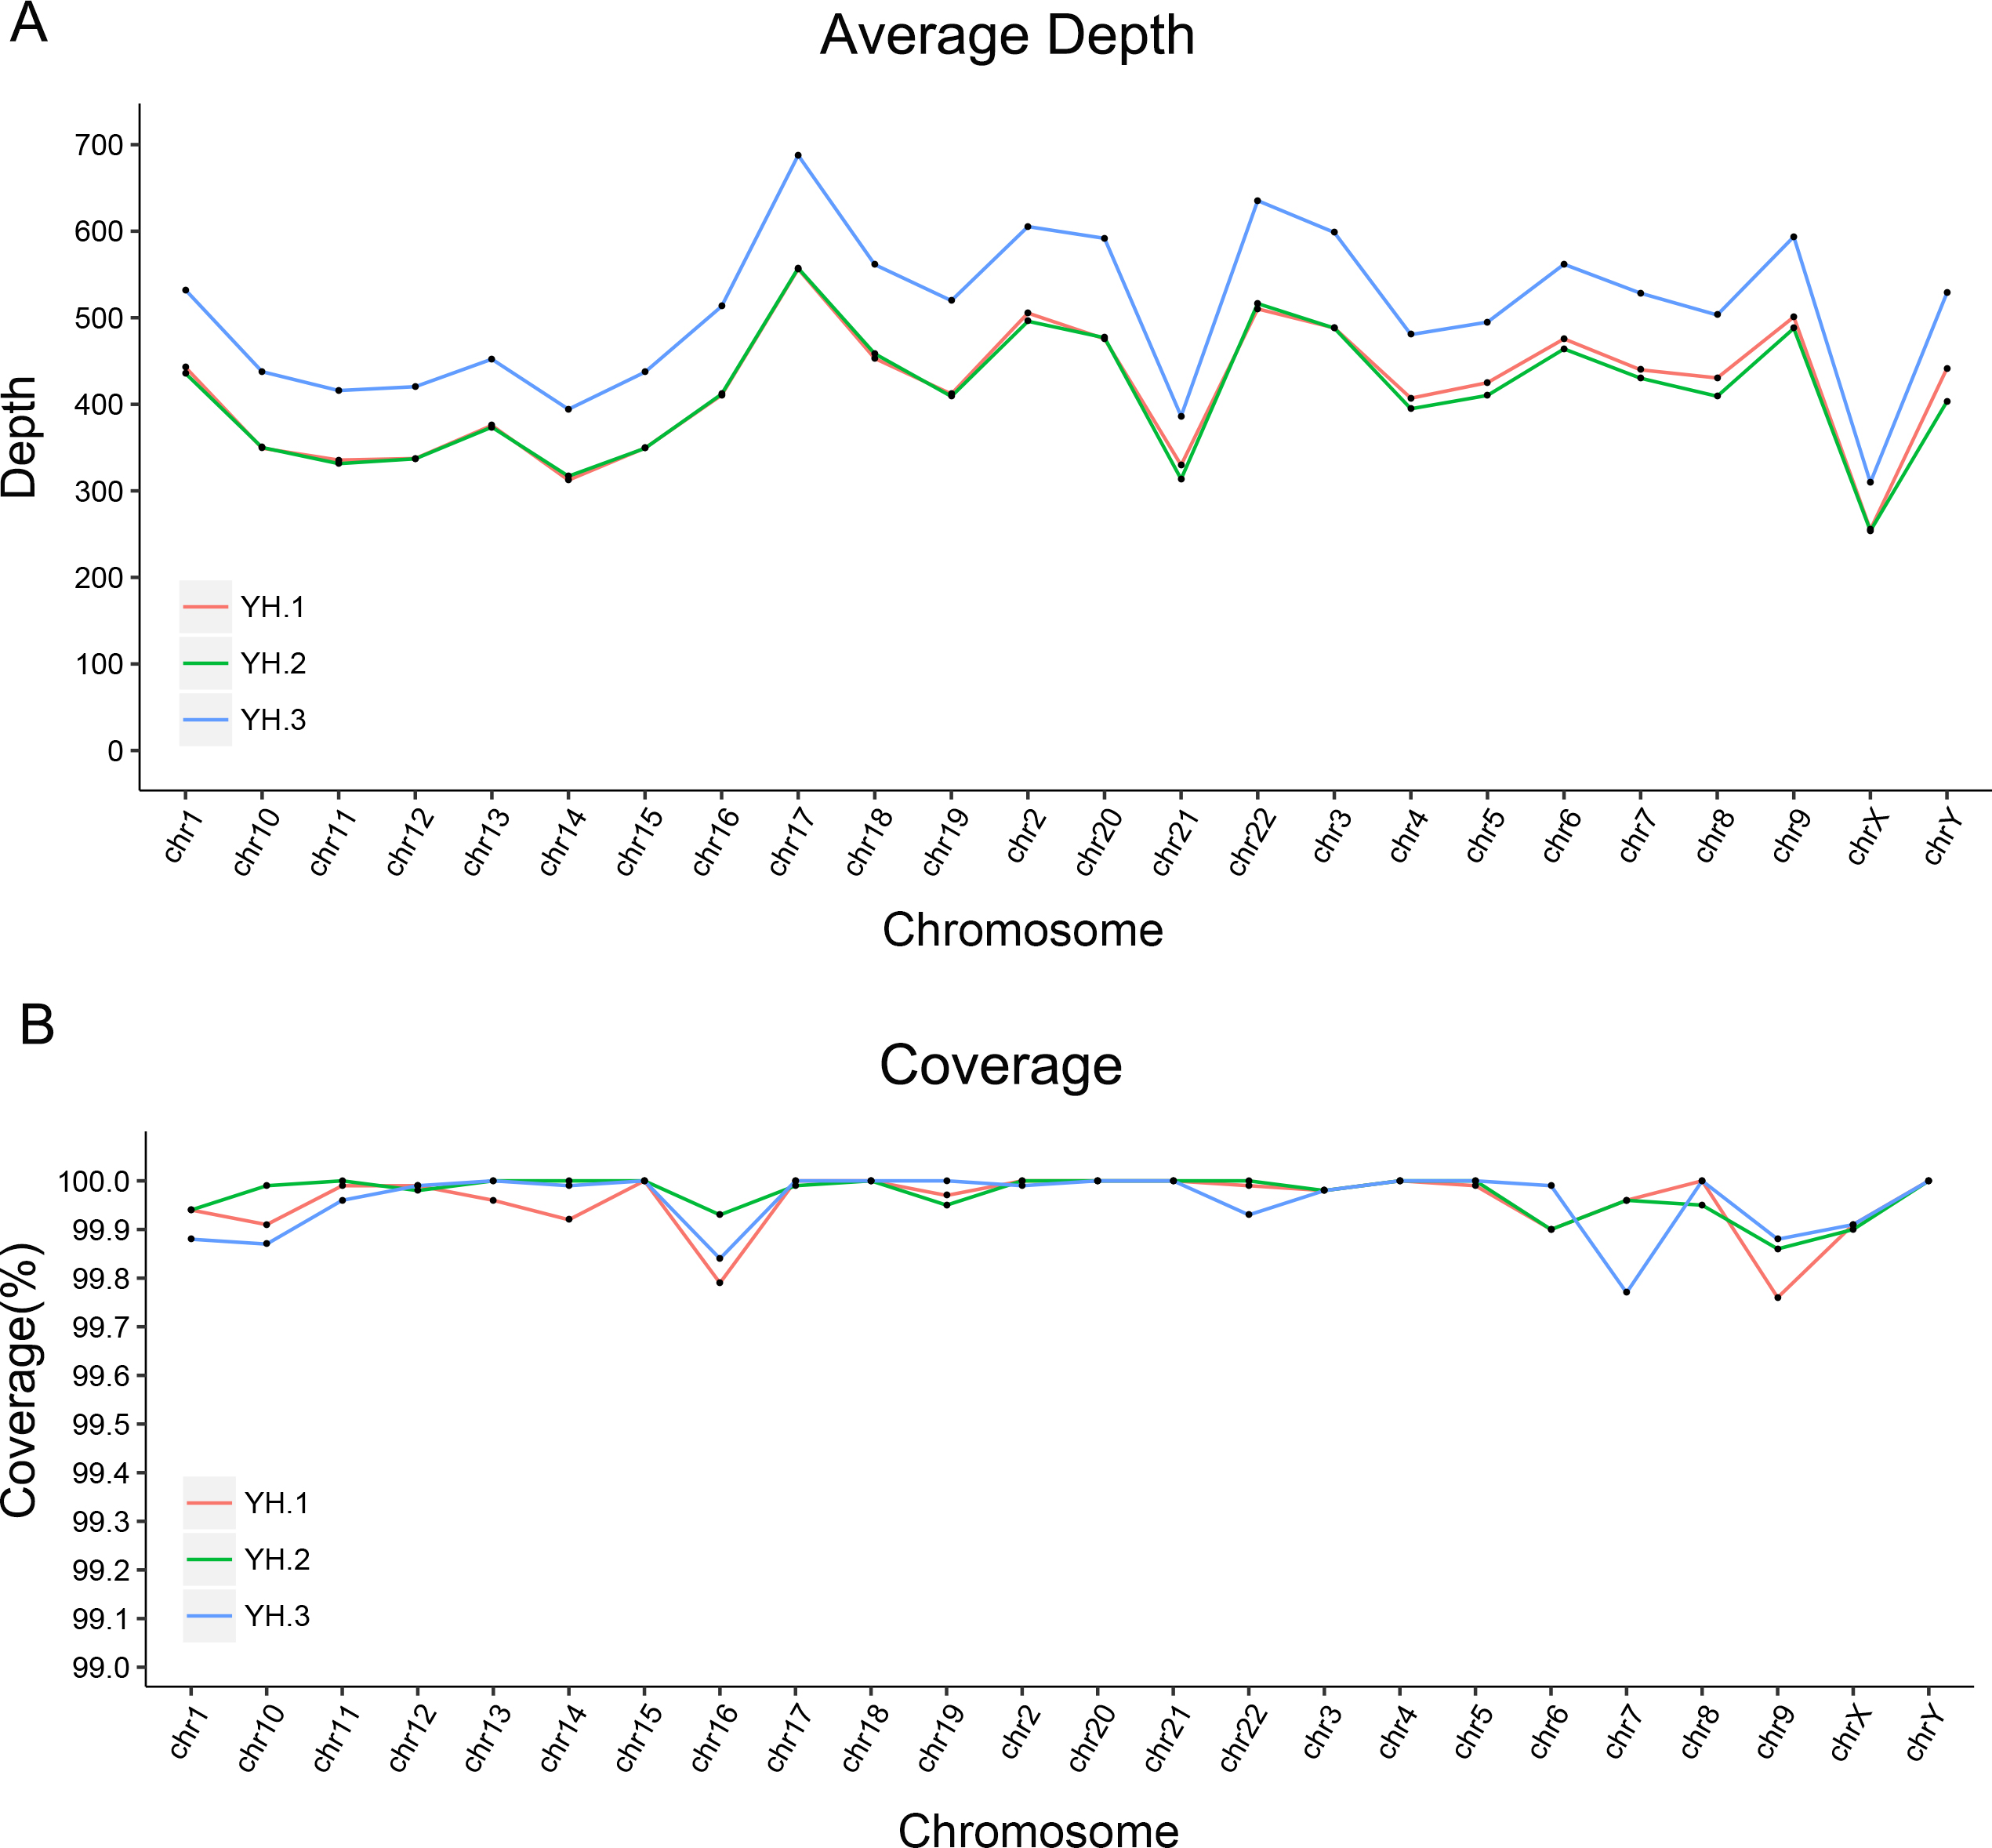
Figure 1.
The evaluation of capture panel by YH sample in different sequencing times (YH.1, YH.2, YH.3).
A
: The average depth of the target regions on different chromosomes.
B
: The coverage (%) of target regions on different chromosomes.
 Figure 1 of
Huang, Mol Vis 2017; 23:605-613.
Figure 1 of
Huang, Mol Vis 2017; 23:605-613.