Figure 9. Protein network visualization of genes differentially expressed in the differentiated RPE cells. Significantly altered up-
and downregulated genes were selected from the RNA sequencing (RNA-Seq) analysis of the RPE cells cultured for 4 days and
for 4 months and were classified by their involvement in specific pathways. The STRING 10 database was used to visualize the
known and predicted protein–protein interactions. Upregulated core set genes are indicated with red arrows and the downregulated
genes with green arrows. The lines and arrows in different colors indicate the data sources: experimental (red), database
(blue), and text-mining (green).
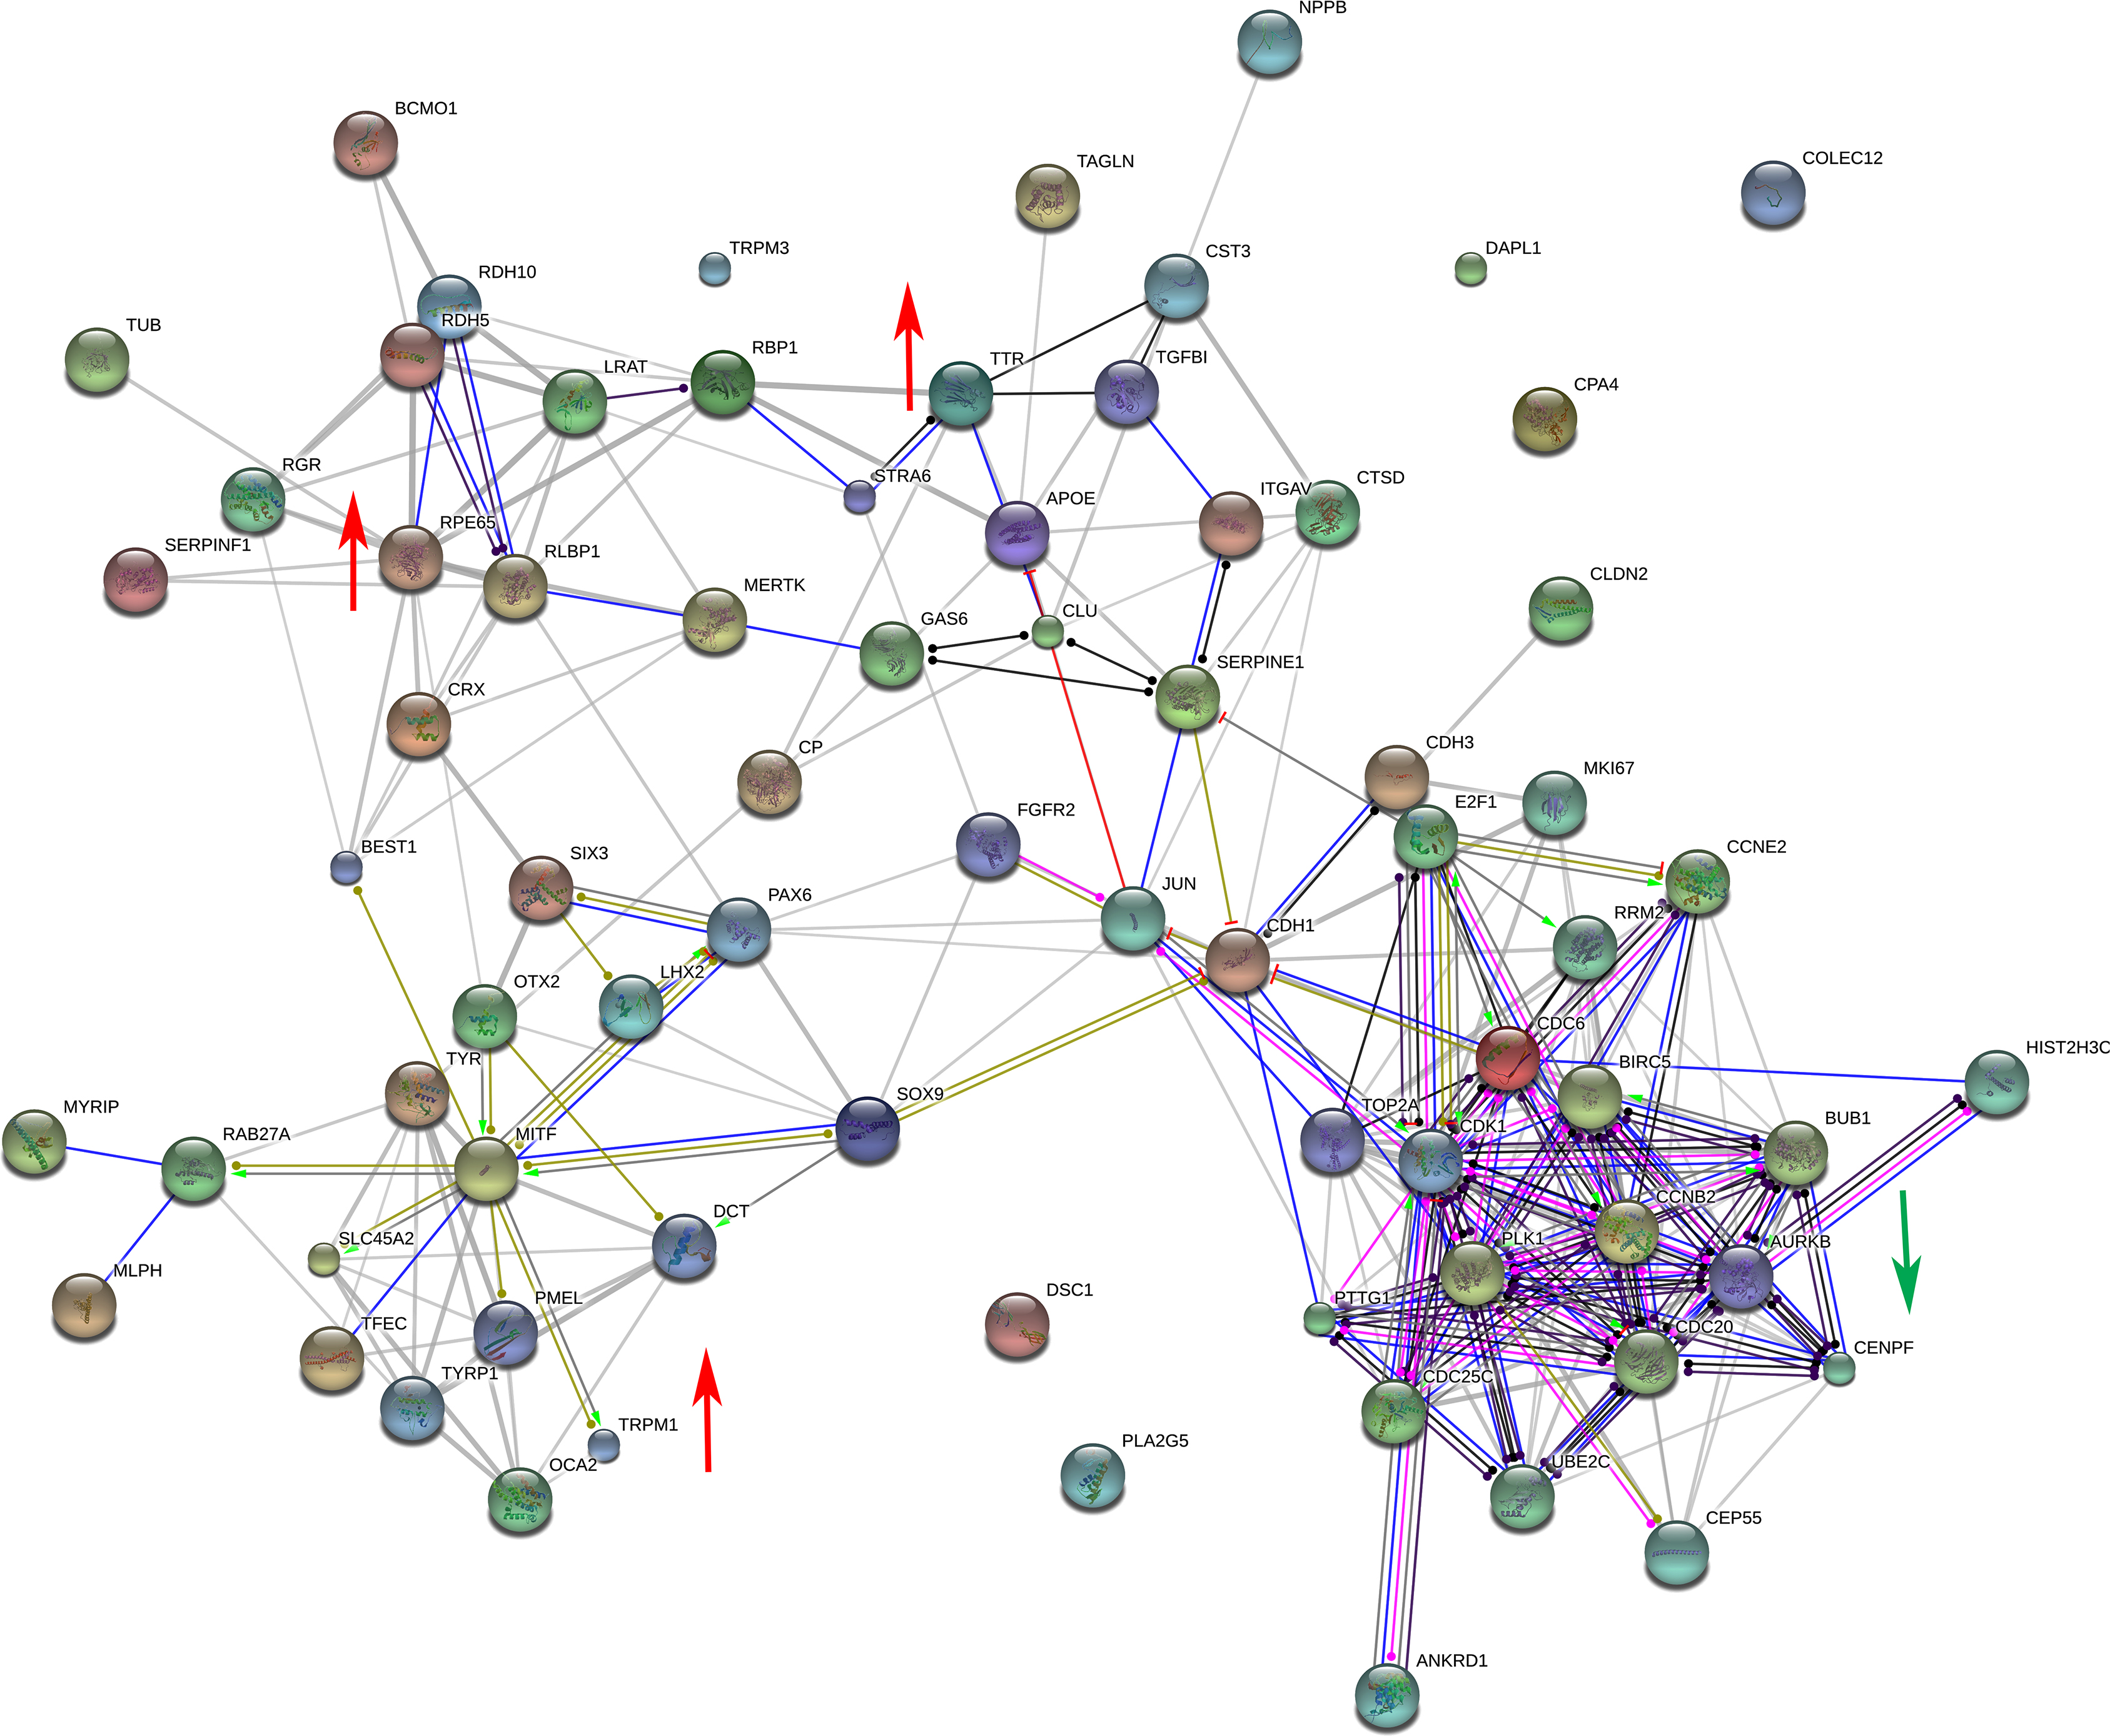
 Figure 9 of
Samuel, Mol Vis 2017; 23:60-89.
Figure 9 of
Samuel, Mol Vis 2017; 23:60-89.