Figure 11. Comparison of visual cycle and RPE signature gene expression. Fragments per thousand bases of gene per million bases mapped
(FPKM) values obtained from RNA sequencing (RNA-Seq) of the ARPE-19 cells cultured for 4 months (ARPE-19 4M), RPE derived
from human embryonic stem cells (H1 and H9) and fetal eyes (HF), and native RPE from the nasal (RPE/CHOR_NAS), temporal (RPE/CHOR_TMP),
and macular (RPE/CHOR_MAC) regions of the RPE/choroid were used for the analysis. A: Comparison of the expression of the visual cycle genes. B: Comparison of the expression of RPE-specific genes. The x-axis indicates the expression levels of the genes analyzed. The
y-axis indicates the transcript expression levels quantified as FPKM on a log10 scale.
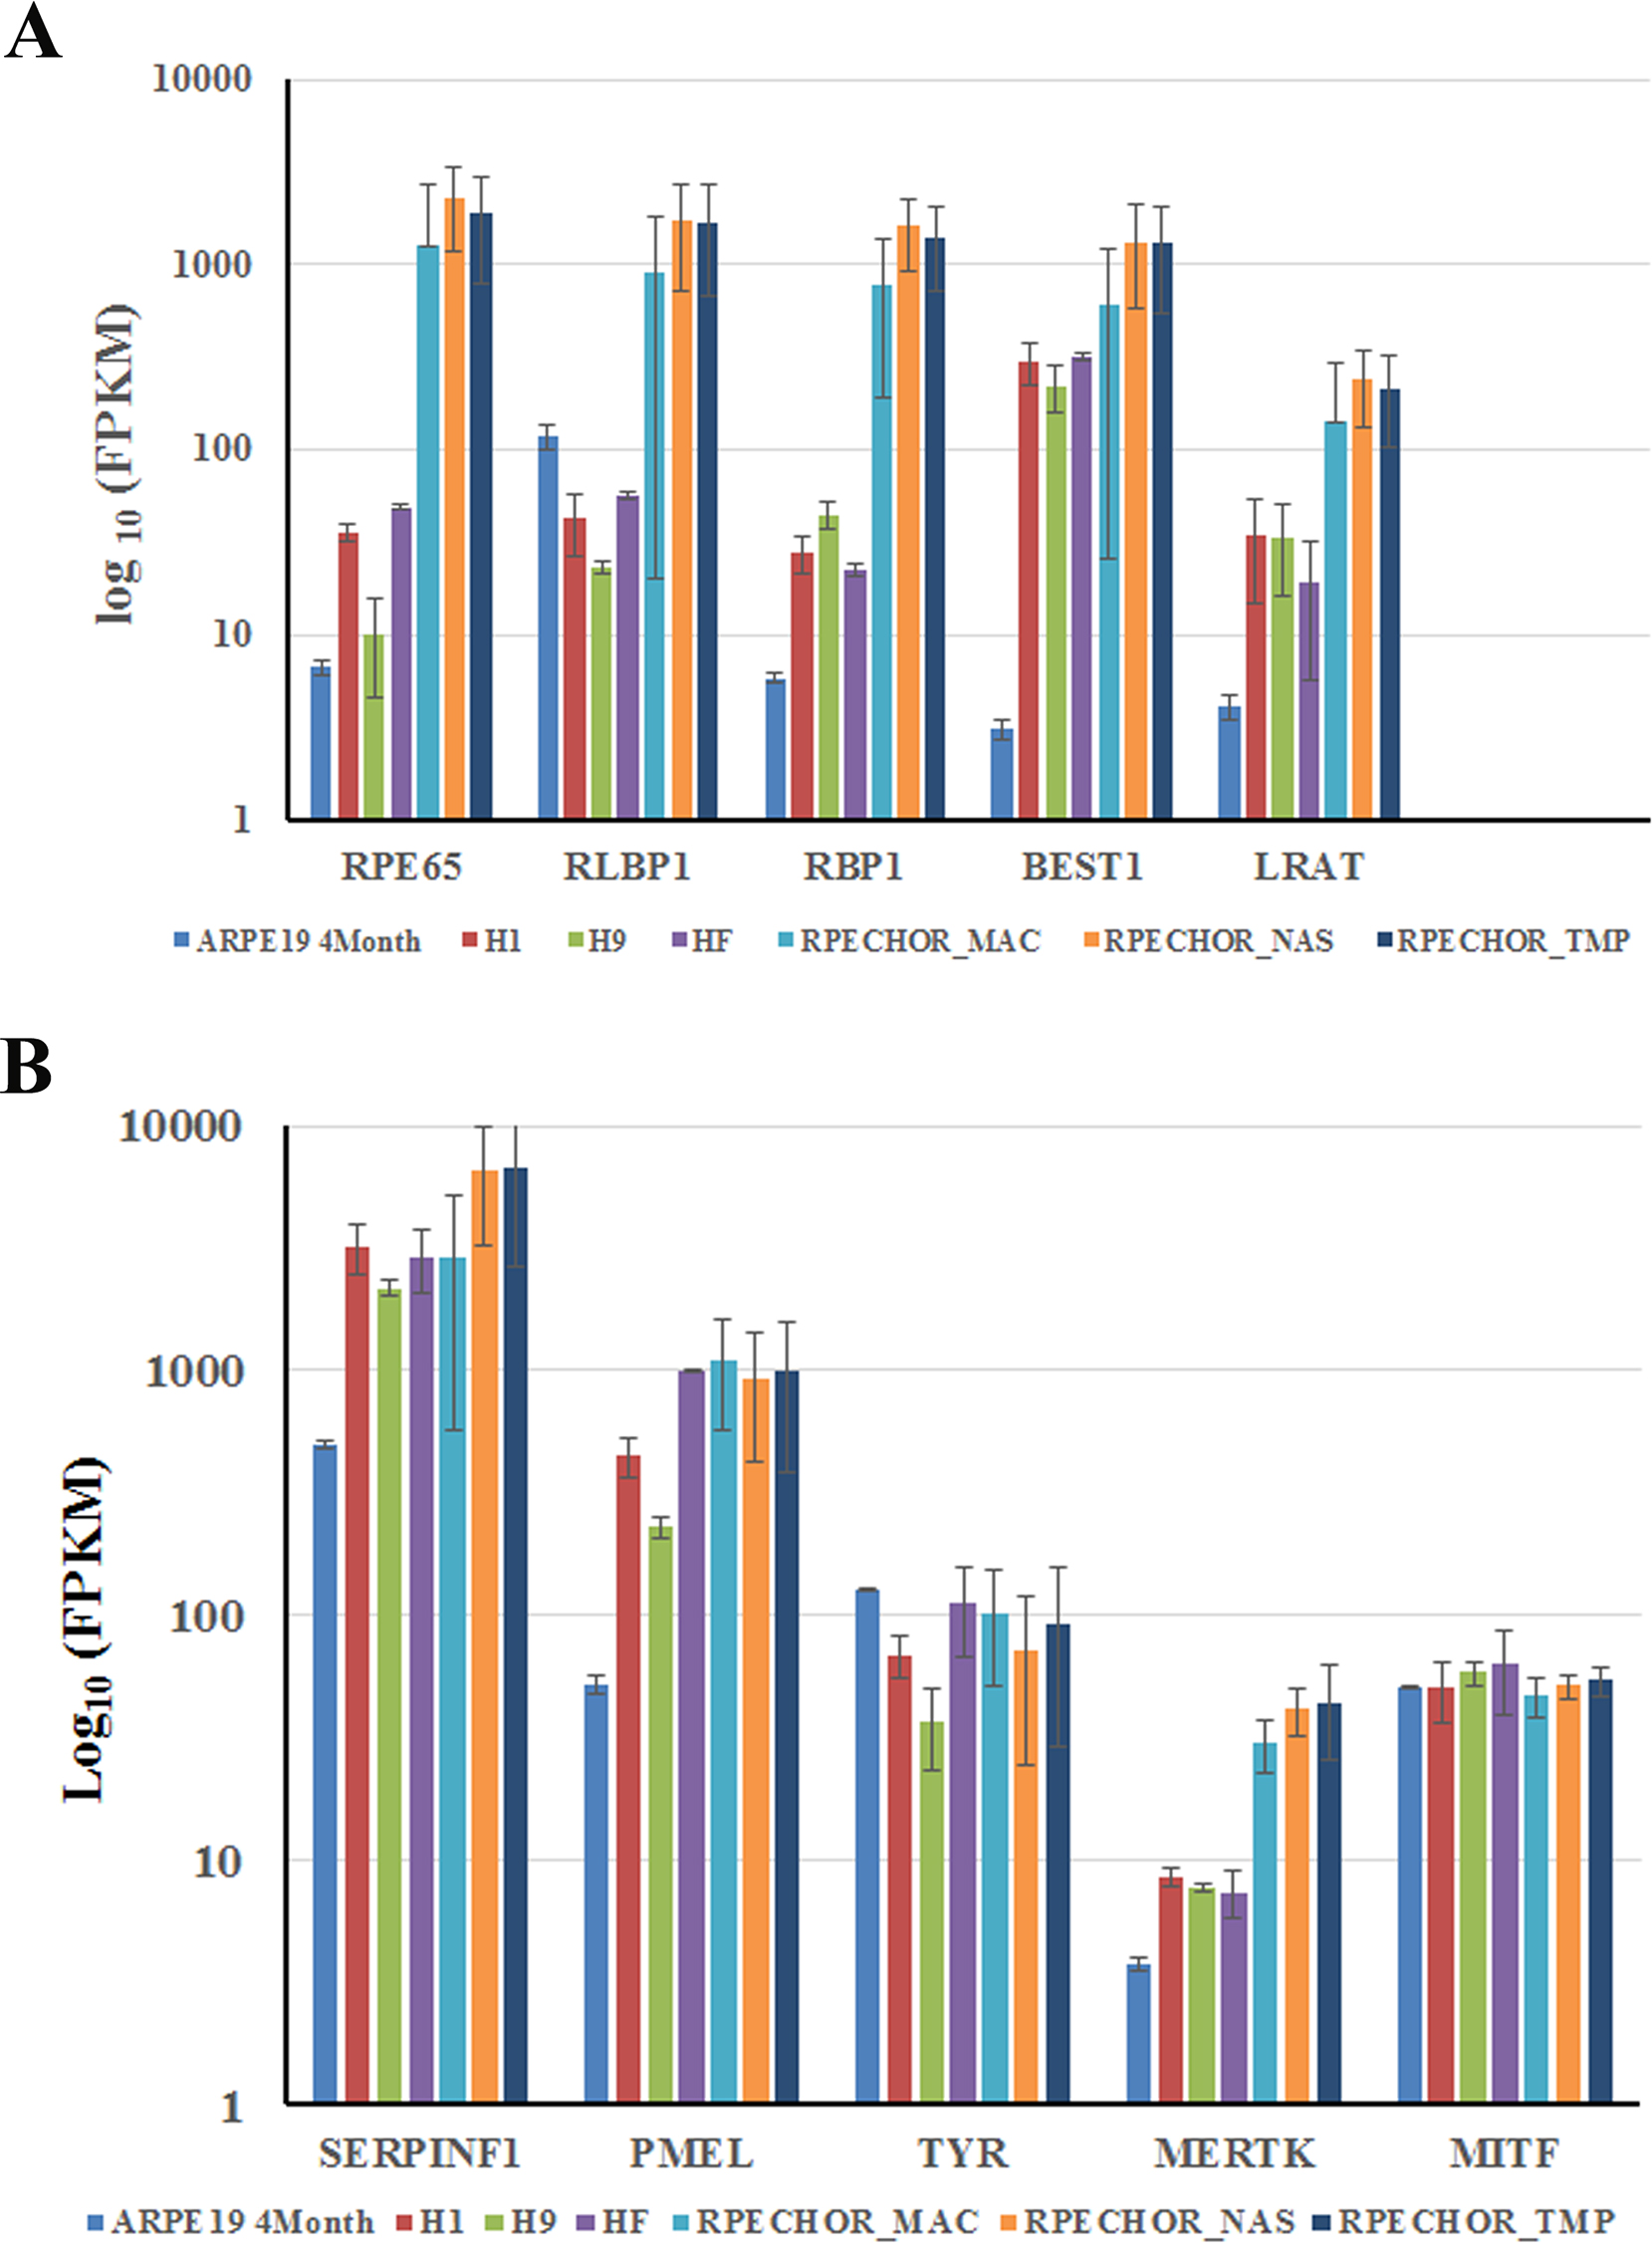
 Figure 11 of
Samuel, Mol Vis 2017; 23:60-89.
Figure 11 of
Samuel, Mol Vis 2017; 23:60-89.