Figure 10. Comparative gene expression analysis between current RNA-Seq experiments and previous transcriptome studies of human primary
and stem cell–derived RPE cells with RNAs sequencing (RNA-Seq). A: The Venn diagram shows the number of common and unique gene expression profiles between the 1,000 most highly expressed
mRNA of the ARPE-19 cells cultured for 4 months (ARPE-19 4M) and RPE derived from human embryonic stem cells (H1 and H9) and
fetal eyes (HF). The union of the four data sets gives rise to 1,511 genes, taken as the total for calculating the percentage
shown. B: The Venn diagram shows the shared and unique genes among the 1,000 most highly expressed genes out of > 20,000 mRNA between
the current RNA-Seq data (ARPE-19 4M), human embryonic stem cell-derived RPE cells (H1), and macular region of the RPE/choroid
(RPE/CHOR_MAC). The union of these three data sets is 1,735 genes, taken as the total for calculating the percentages shown.
C–H: Scatter plots with regression lines show the relations between each comparison. The regression line is in red. R = Pearson
correlation coefficient; S = Spearman correlation coefficient. The x-axis corresponds to the gene expression observed in the
ARPE-19 cells cultured for 4 months. The y-axis displays the RNA-Seq data set derived from the source.
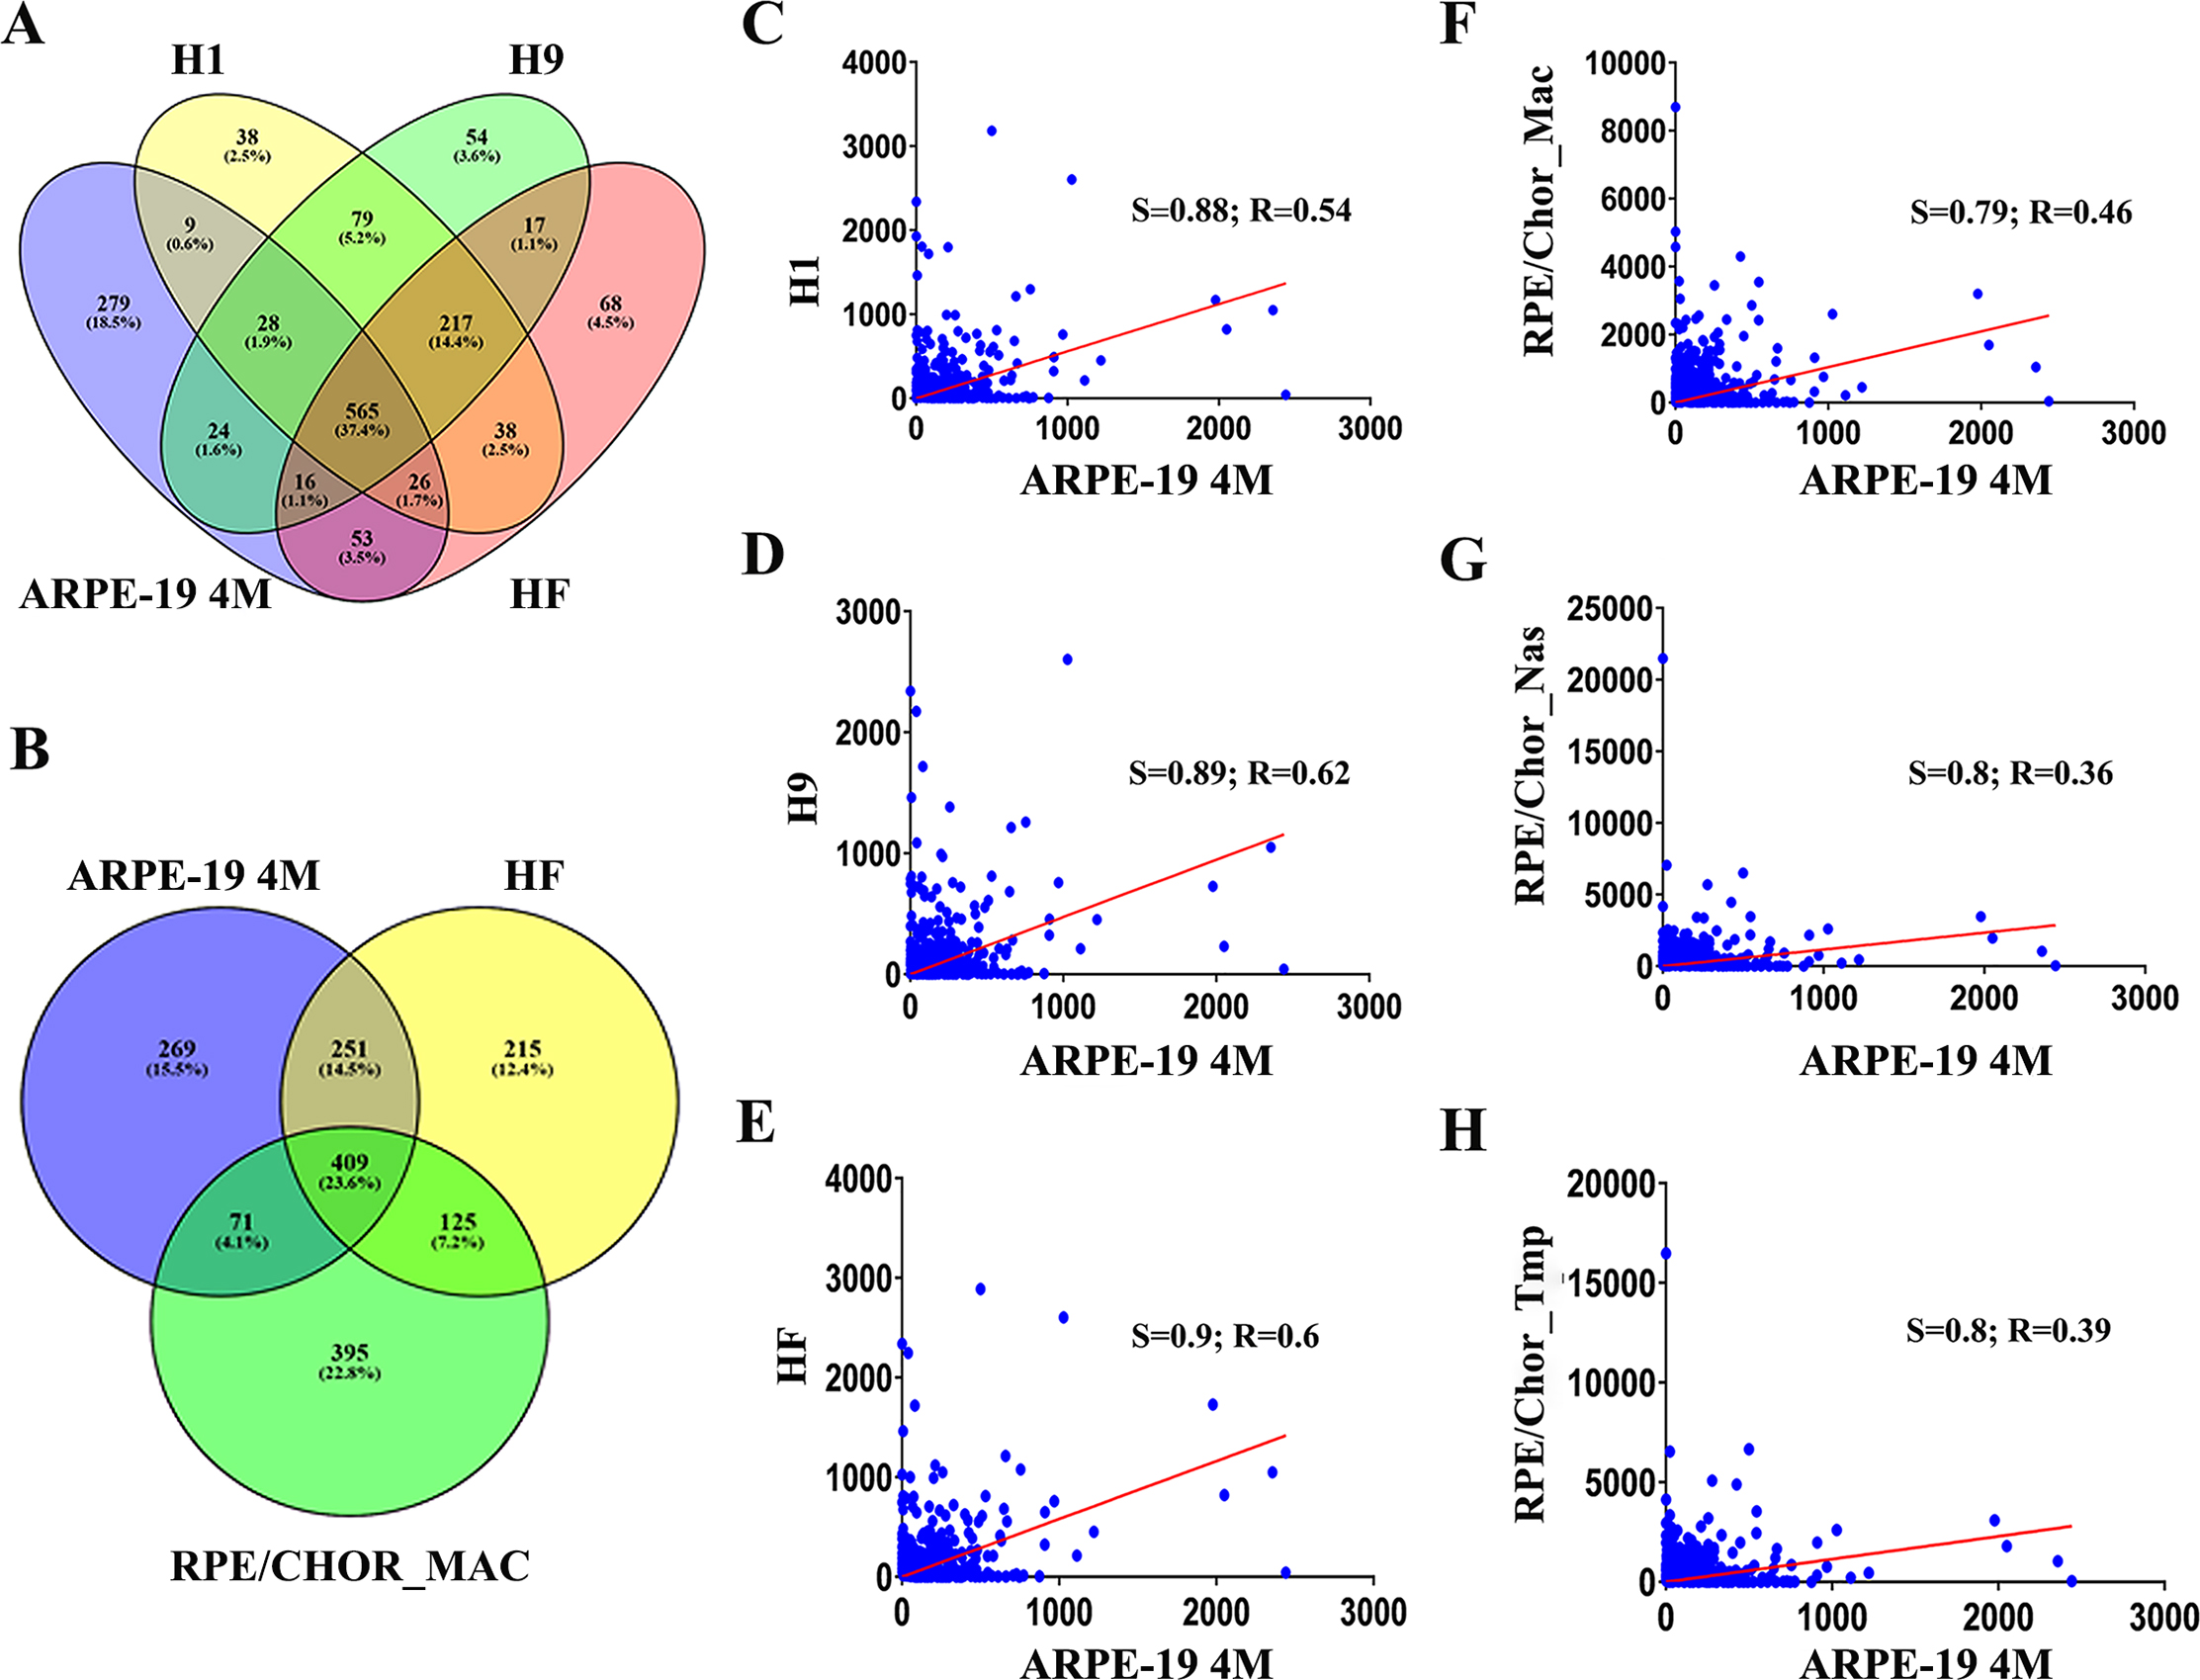
 Figure 10 of
Samuel, Mol Vis 2017; 23:60-89.
Figure 10 of
Samuel, Mol Vis 2017; 23:60-89.