Figure 3. Plot of the principal component analysis for the Kooperative Gesundheitsforschung in der Region Augsburg (KORA) and TwinsUK
cohorts. The KORA cohort is shown in blue, while the TwinsUK cohort is shown in green. Principal component 1 (EV = 4.33712)
was plotted against principal component 2 (EV = 1.15219) in these two cohorts.
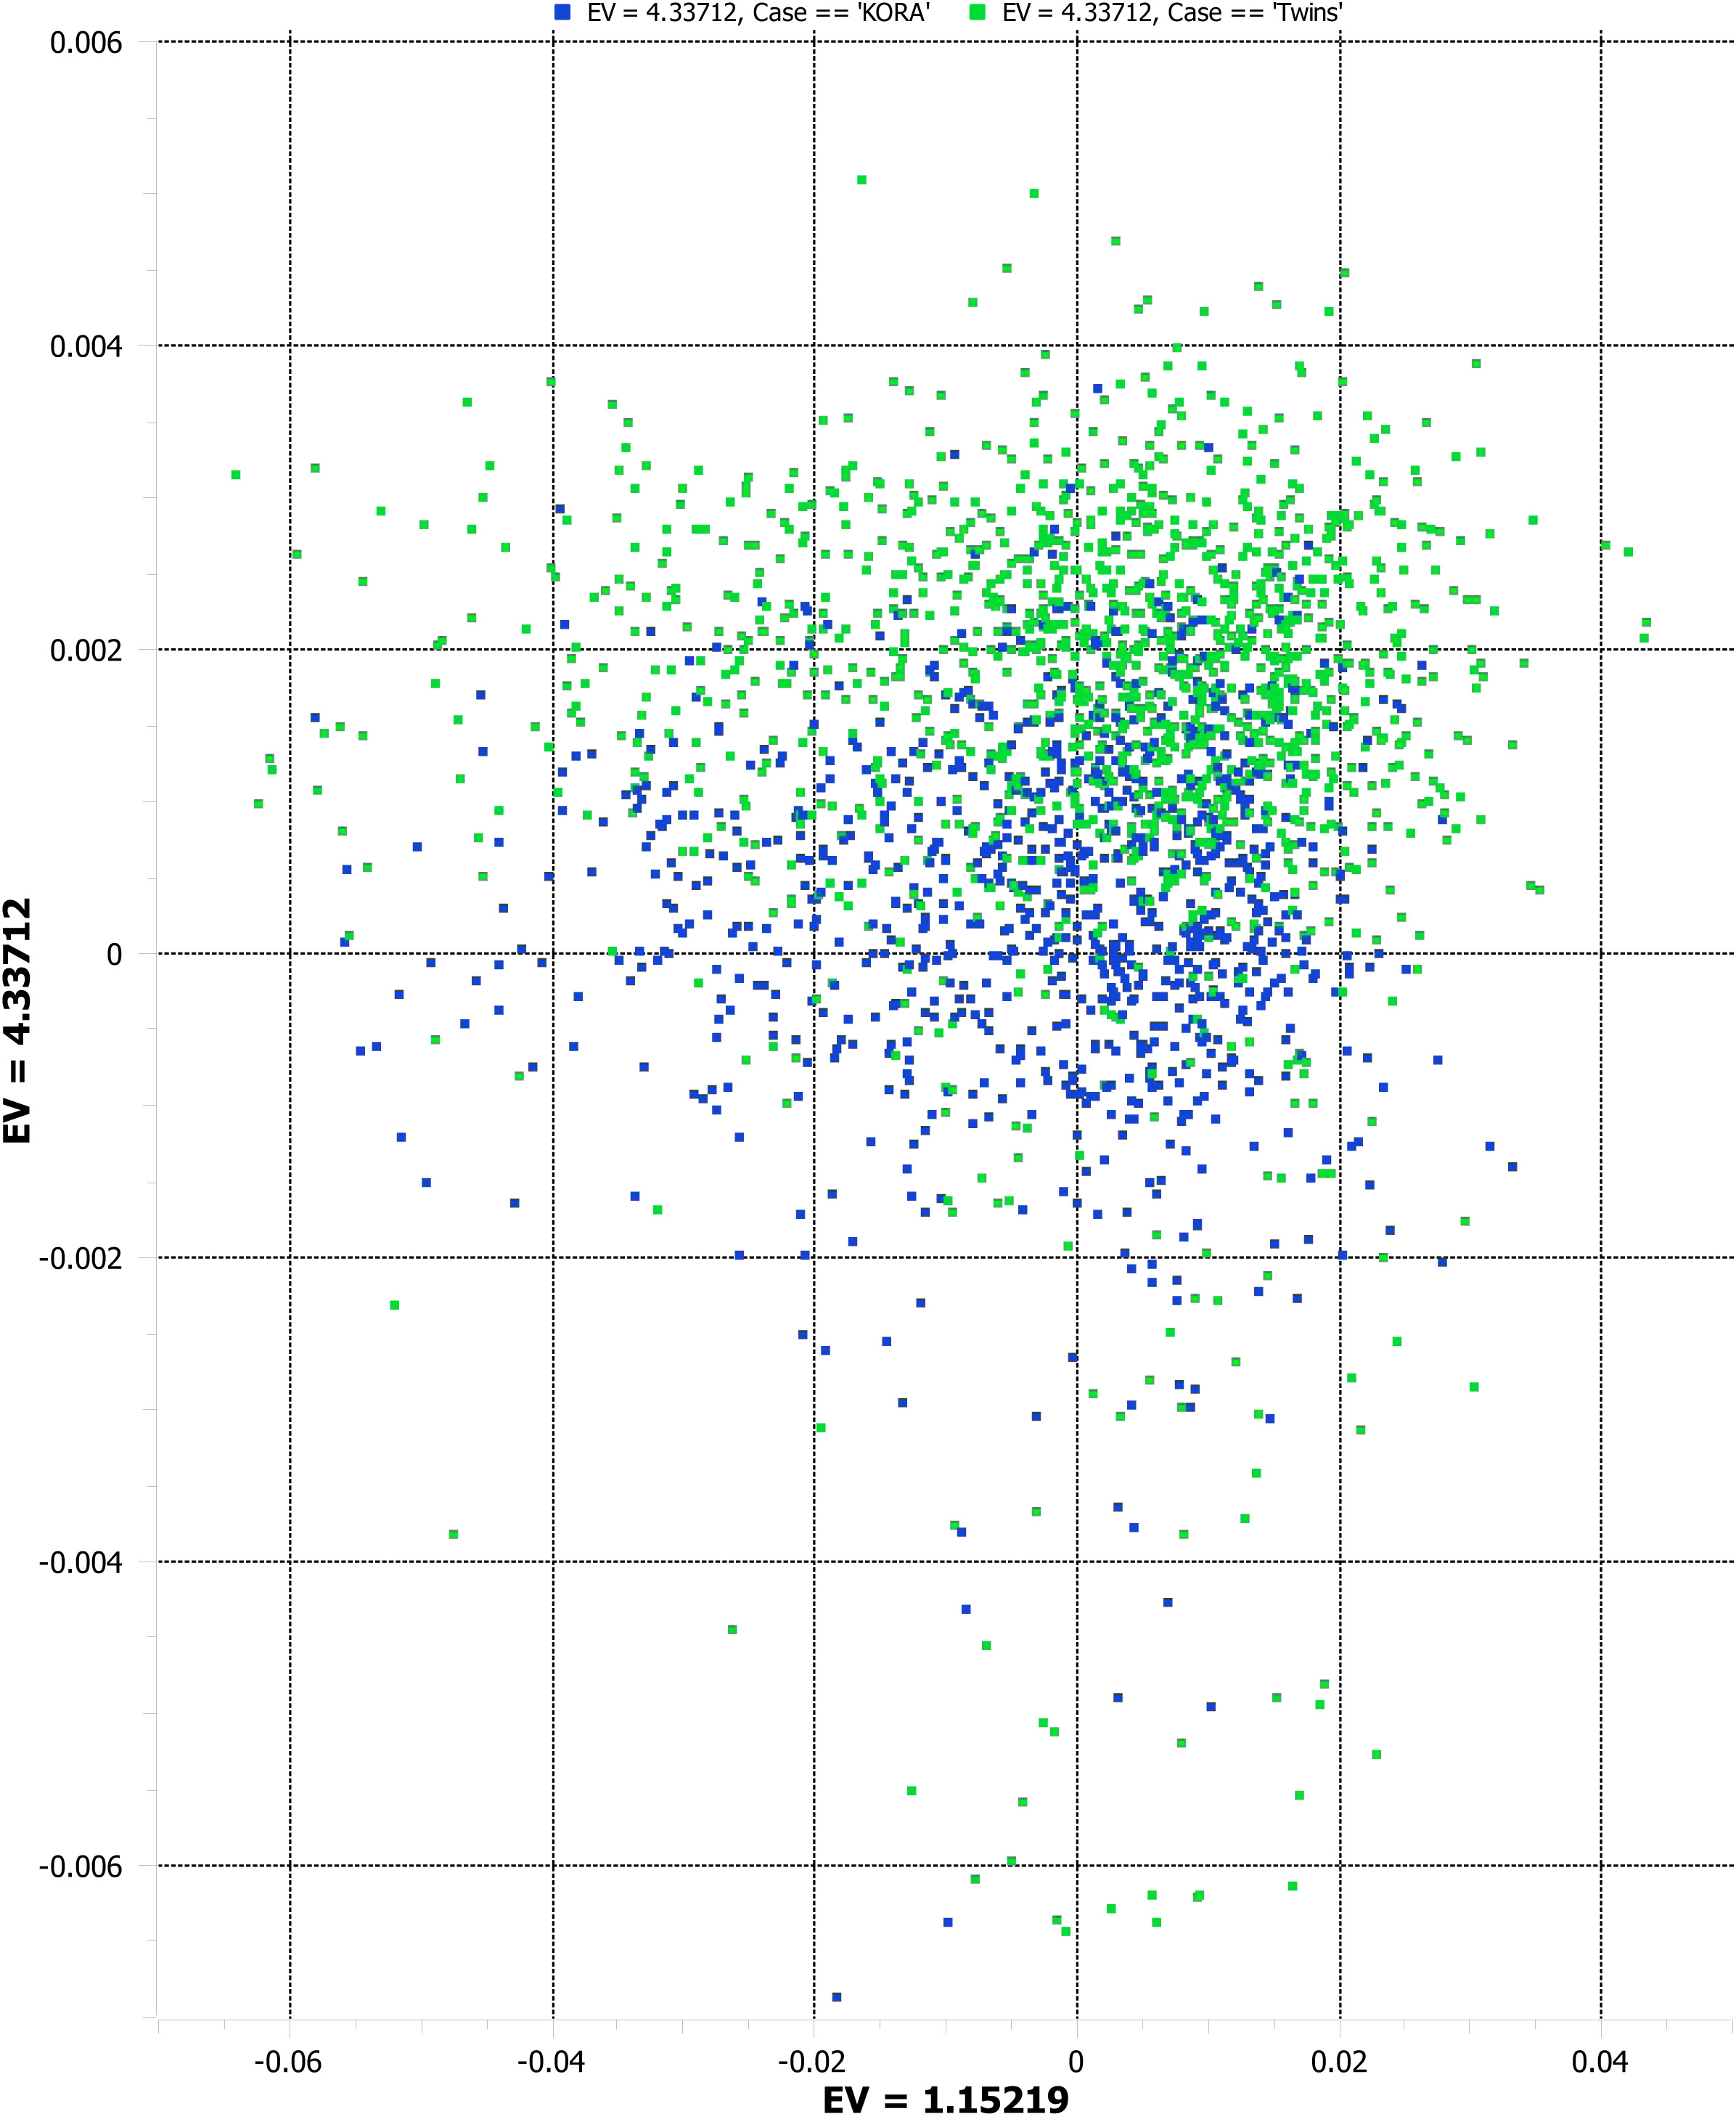
 Figure 3 of
Li, Mol Vis 2017; 23:588-604.
Figure 3 of
Li, Mol Vis 2017; 23:588-604.