Figure 1. Variants detected in patients with clinically diagnosed optic atrophy. A: Pie chart showing the distribution of mutations in the sample by gene and mitochondrial DNA. Numbers represent the number
of unrelated patients and the percentage of patients with variants in a gene in the sample. B: Distribution of OPA1 variants by mutation type; percentage among patients with mutations in OPA1 are included. C: Example sequence traces depicting selected variants relative to controls. D: Example of a multiplex ligation-dependent probe amplification (MLPA) result depicting a deletion involving exons 26–28.
Error bars represent the standard error of the mean; n = 3 MLPA reactions. *depicts p<0.05 compared to control averages. E: Schematic of the OPA1 gene (NM_130837.2). Exons are labeled according to number; the 31st exon is non-coding. Functional domains are indicated immediately below the gene. Sequence variants (above) and copy number
variants (below) are indicated according to their position along the OPA1 gene.
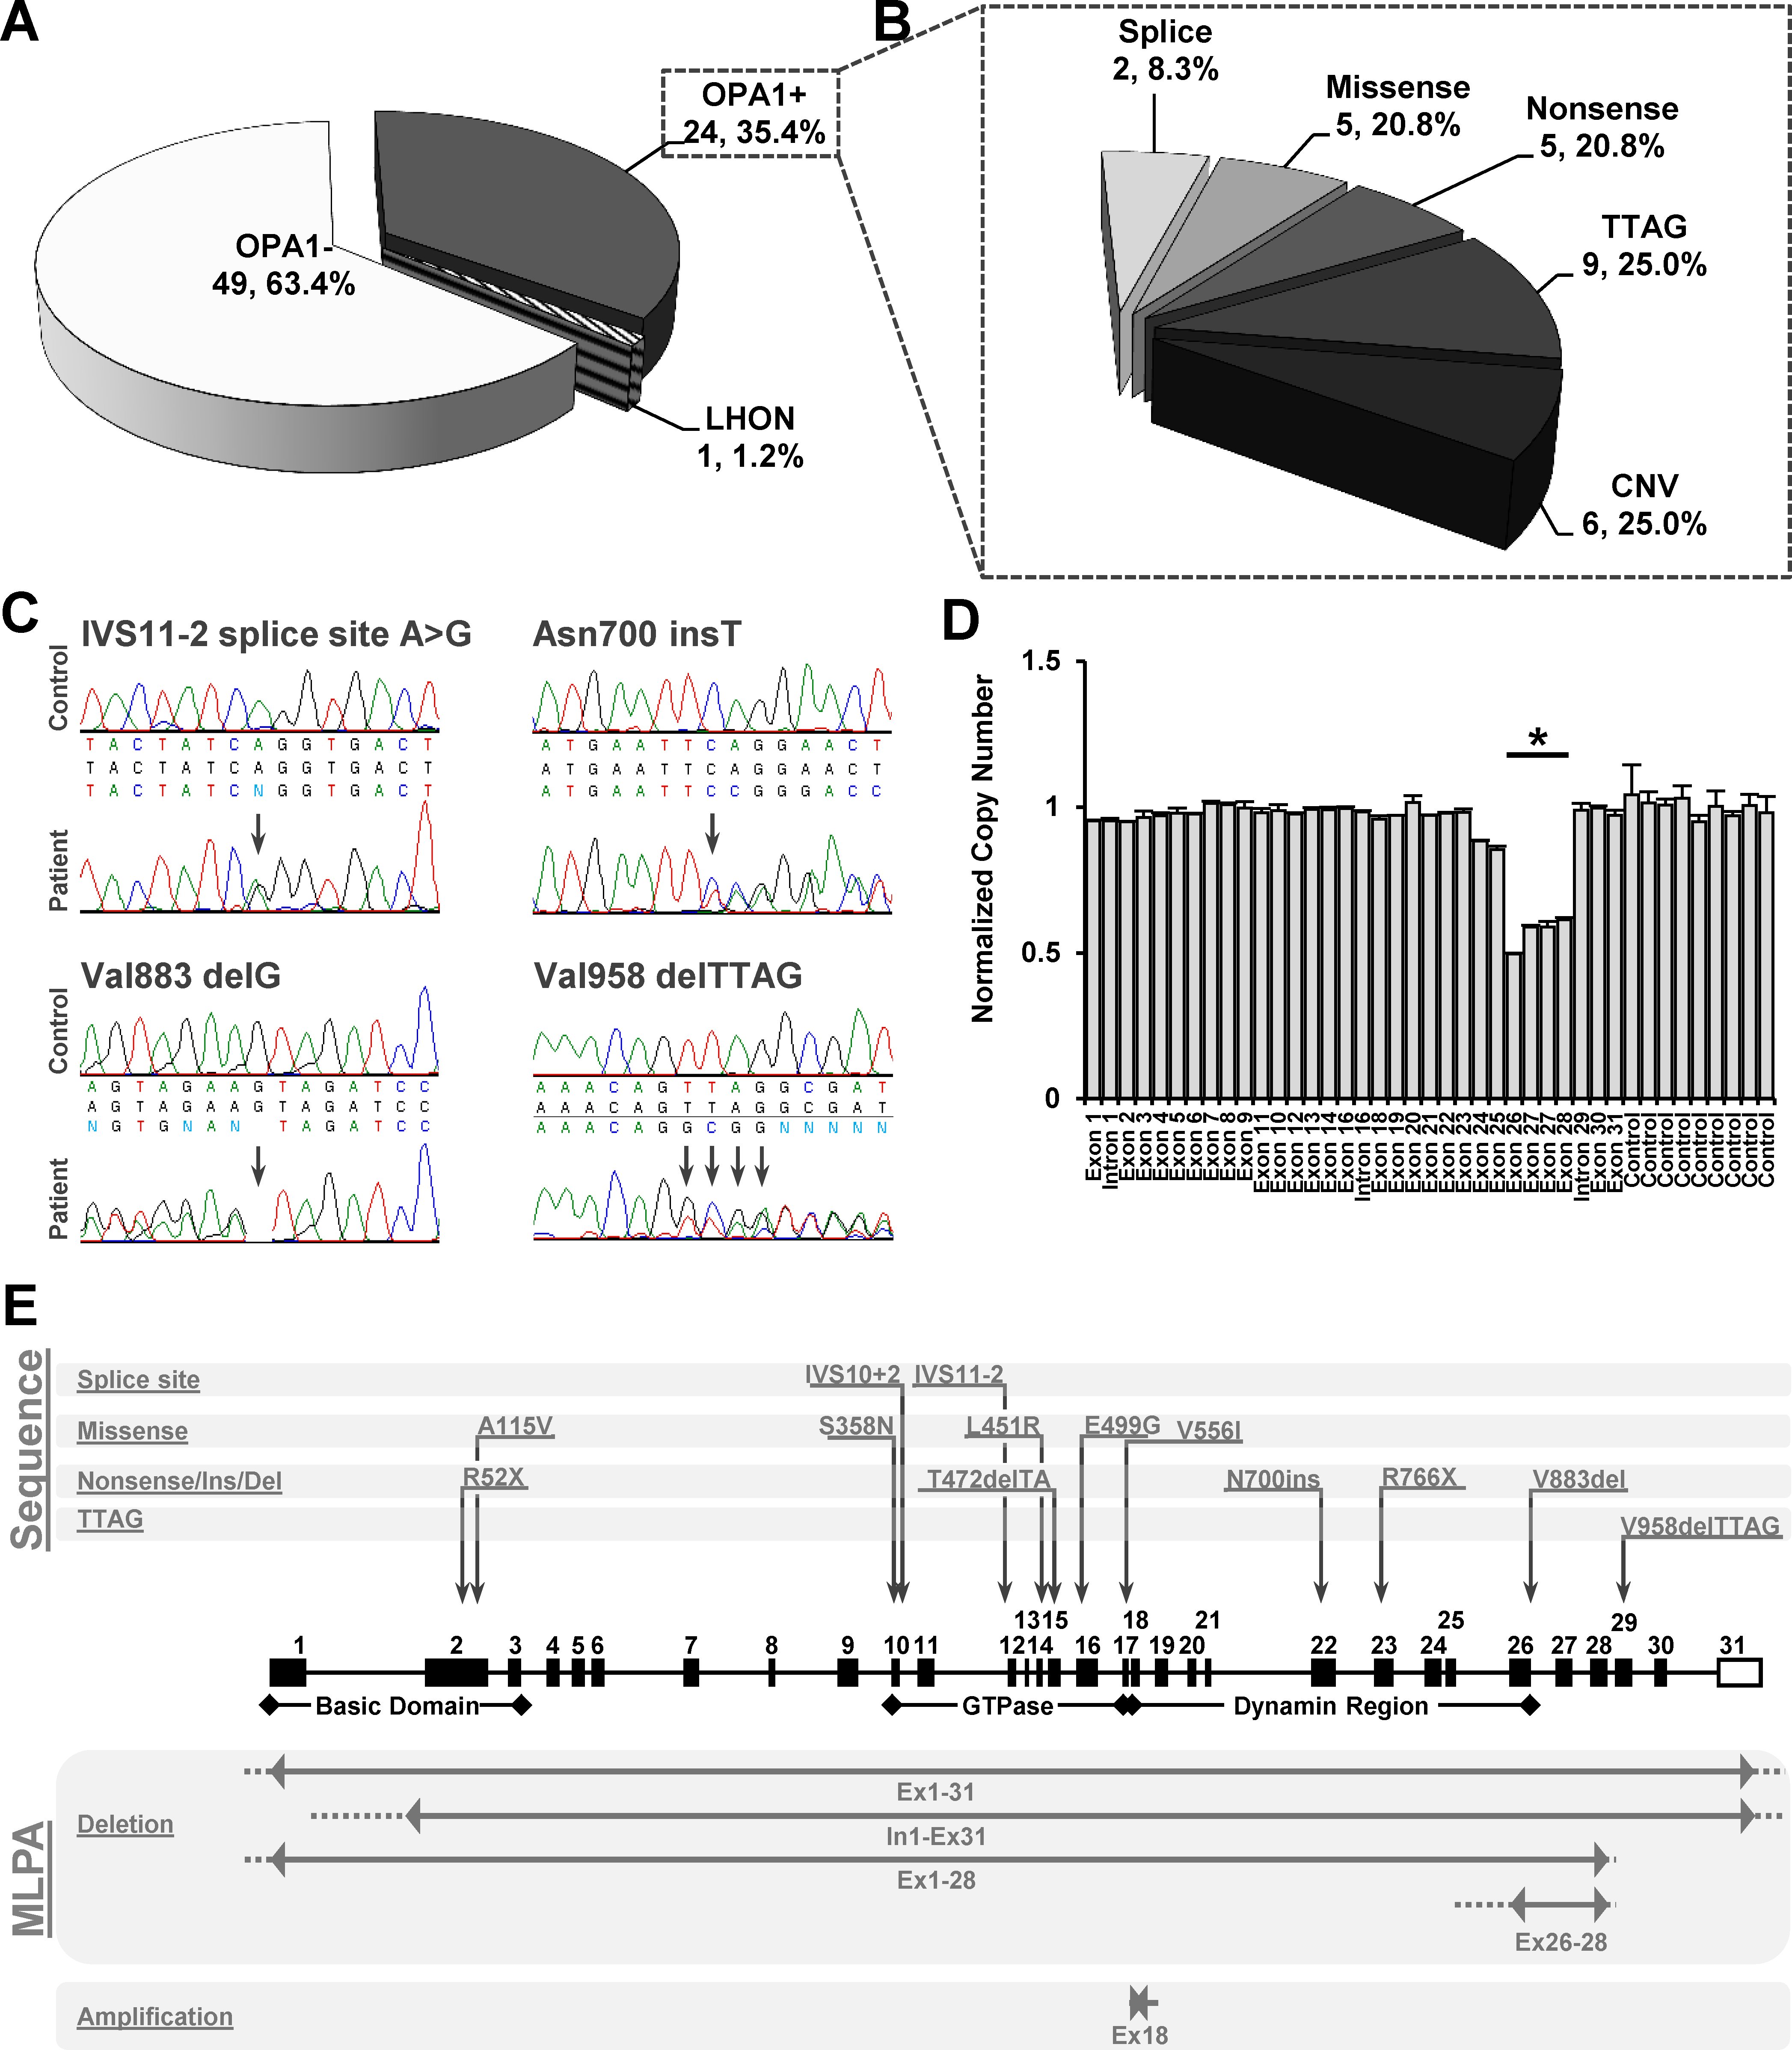
 Figure 1 of
Gaier, Mol Vis 2017; 23:548-560.
Figure 1 of
Gaier, Mol Vis 2017; 23:548-560.