Figure 5. Densitometric analyses of individual immunoblots are shown, as well as the median and the interquartile range. A: Relative densities calculated for each tear sample collected from the right eyes for each method and probed for MUC5AC.
The median signal intensity for samples collected using the Schirmer’s strip (2.86, n = 15) was statistically significantly
higher (p = 0.01) when compared to samples collected using the flush method (1.67, n = 9). B: Relative densities calculated for each tear sample collected from the left eyes for each method and probed for MUC16. The
median signal intensity was statistically significant higher for basal tears (5.24, n = 15) when compared to the Schirmer’s
strip (1.88, n = 14) and flush tears (2.45, n = 7; p = 0.0003, p = 0.006). ** p<0.01 and *** p<0.001.
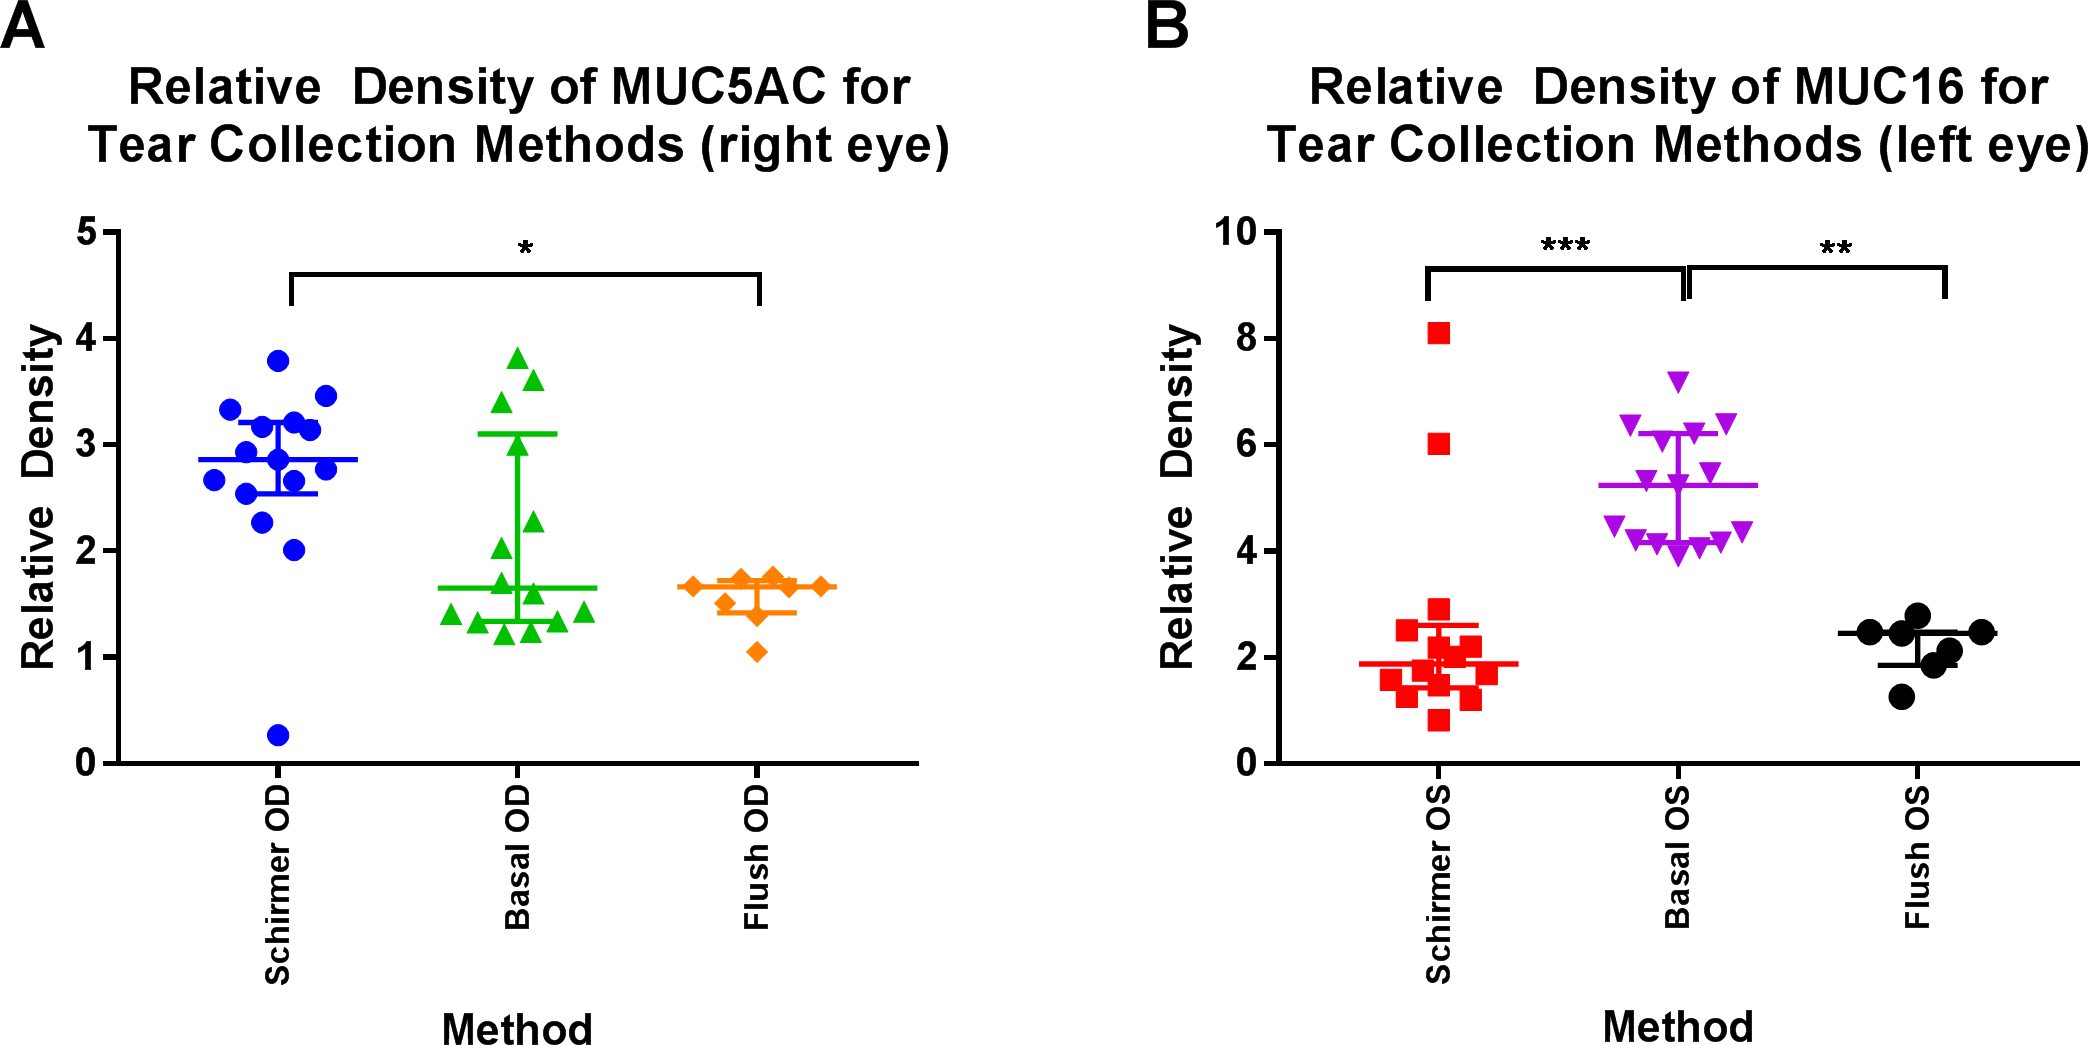
 Figure 5 of
Ablamowicz, Mol Vis 2017; 23:529-537.
Figure 5 of
Ablamowicz, Mol Vis 2017; 23:529-537.