Figure 2. Taxifolin inhibited H2O2-induced apoptosis in RPE cells. A: ARPE-19 cells were divided into four groups: a control group, taxifolin-treated group, H2O2 (0.4 mM)-treated group, and H2O2 (0.4 mM) plus taxifolin (100 μg/ml)-treated group. Flow cytometry recording shows the apoptosis rate of RPE cells. B: Quantitative data show the rate of apoptotic cells detected with flow cytometry. C: The expression levels of PARP cleavage were determined by western blot analysis. Data are shown as the mean ± SD (n = 3);
*p<0.05, **p<0.01, and *** p<0.001.
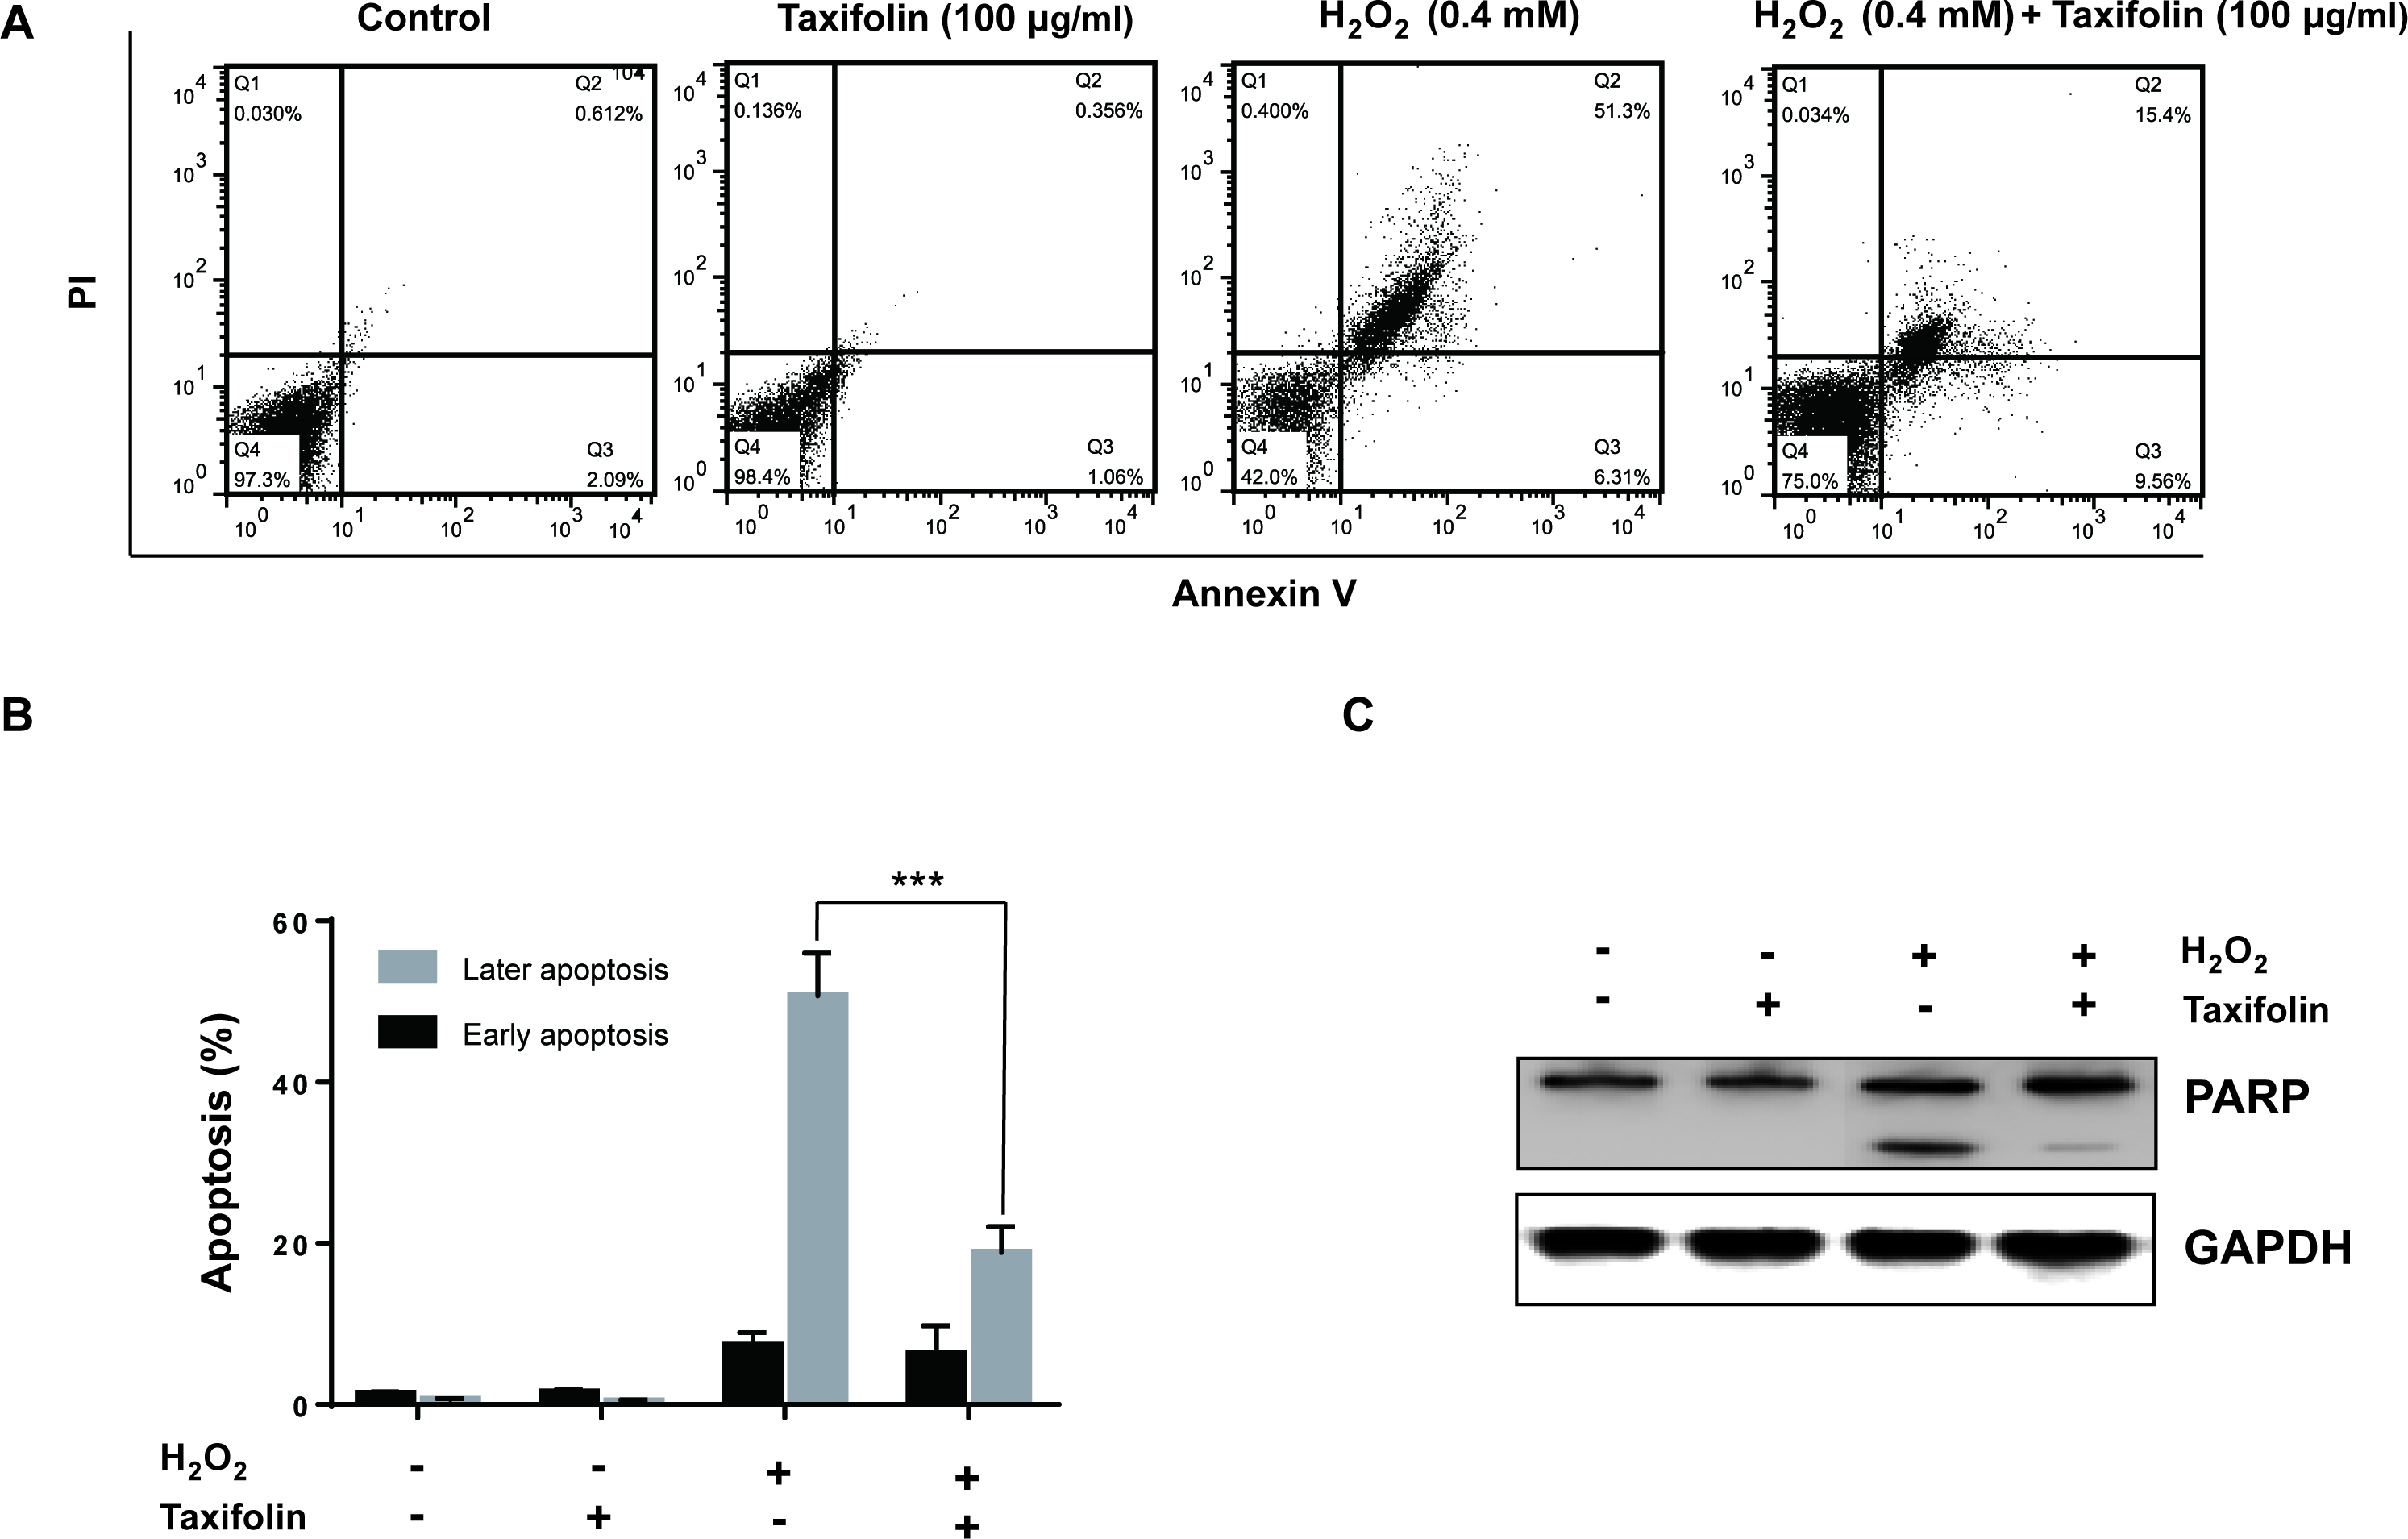
 Figure 2 of
Xie, Mol Vis 2017; 23:520-528.
Figure 2 of
Xie, Mol Vis 2017; 23:520-528.