Figure 5. Effects of S-opsin siRNA on exposure to blue LED light in murine photoreceptor cells. A: Representative immunoblotting images of short-wavelength opsin (S-opsin), ATF4, and β-actin. B: Expression level of S-opsin. C: Expression level of ATF4. Data are presented as the mean ± standard error of the mean (SEM; n=7 to 9). **p<0.01, #p<0.05
versus normal (control); †p<0.05, † † p<0.01 versus normal (blue light-emitting diode [LED]); (Student t test). N, normal; NC, negative control siRNA.
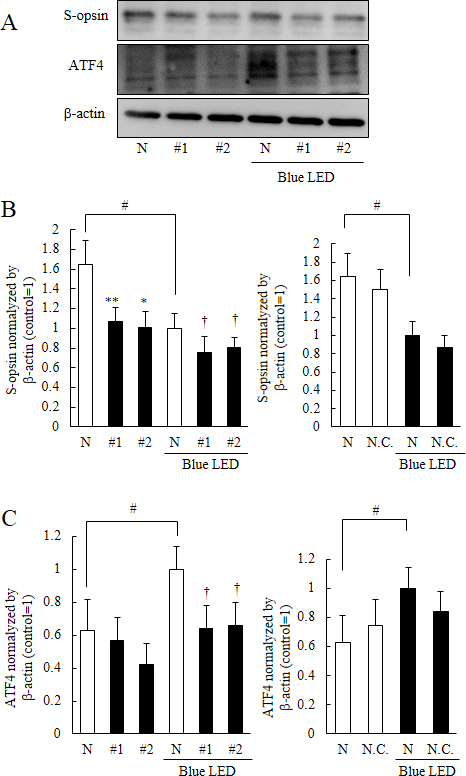
 Figure 5 of
Ooe, Mol Vis 2017; 23:52-59.
Figure 5 of
Ooe, Mol Vis 2017; 23:52-59.