Figure 4. The aggregation of S-opsin induced by exposure to blue LED light or ER stress inducers. A: Representative immunostaining images of short-wavelength opsin (S-opsin) after exposure to blue light-emitting diode (LED)
light for 6 h. B: 2 μg/ml tunicamycin treated for 12 h. C: 0.5 mM dithiothreitol (DTT) treated for 6 h. D: Quantitative analysis of the immunostaining images. The ratio of aggregated S-opsin cells. Data are presented as the mean
± standard error of the mean (SEM; n=3 or 4). *p<0.05, * * p<0.01 versus control (one-way ANOVA followed by Dunnett’s test).
Scale bar=50 μm. Arrowheads indicate the aggregation of S-opsin.
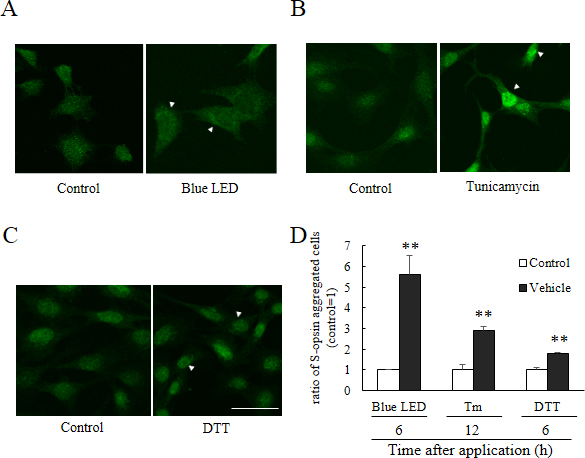
 Figure 4 of
Ooe, Mol Vis 2017; 23:52-59.
Figure 4 of
Ooe, Mol Vis 2017; 23:52-59.