Figure 3. Changes in ubiquitinated protein level induced by exposure to blue LED light. Immunoblotting shows the ubiquitinated protein
levels. A: Representative image. B: Quantitative data of the immunoblot. Data are presented as the mean ± standard error of the mean (SEM; n=6). *p<0.05 versus
control (Student t test).
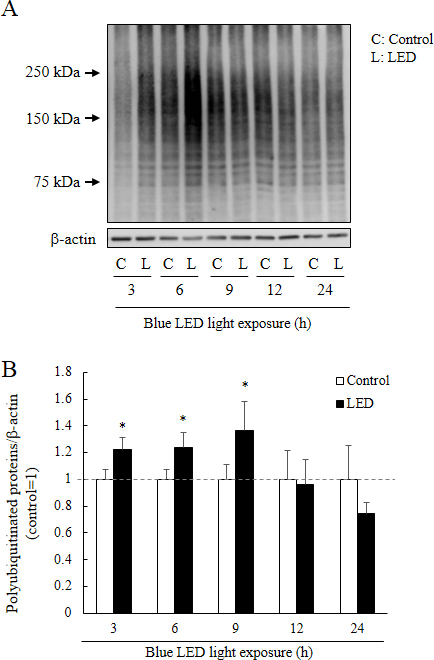
 Figure 3 of
Ooe, Mol Vis 2017; 23:52-59.
Figure 3 of
Ooe, Mol Vis 2017; 23:52-59.