Figure 5. Representative images from TEM of endothelial cells after surgery (10,000X). A: In the PBS group, the endothelium is flatly arranged. B: In the 0.2% GP-CXL group, the endothelium is flatly arranged. The nucleolus chromatin shows a normal distribution and structure.
C–E: In the UVA-CXL group, the mitochondria in the endothelial cells are swollen and the cristae are fractured (black triangle).
F: Some broken endothelial cells have lost their normal hexagonal structures (black star).
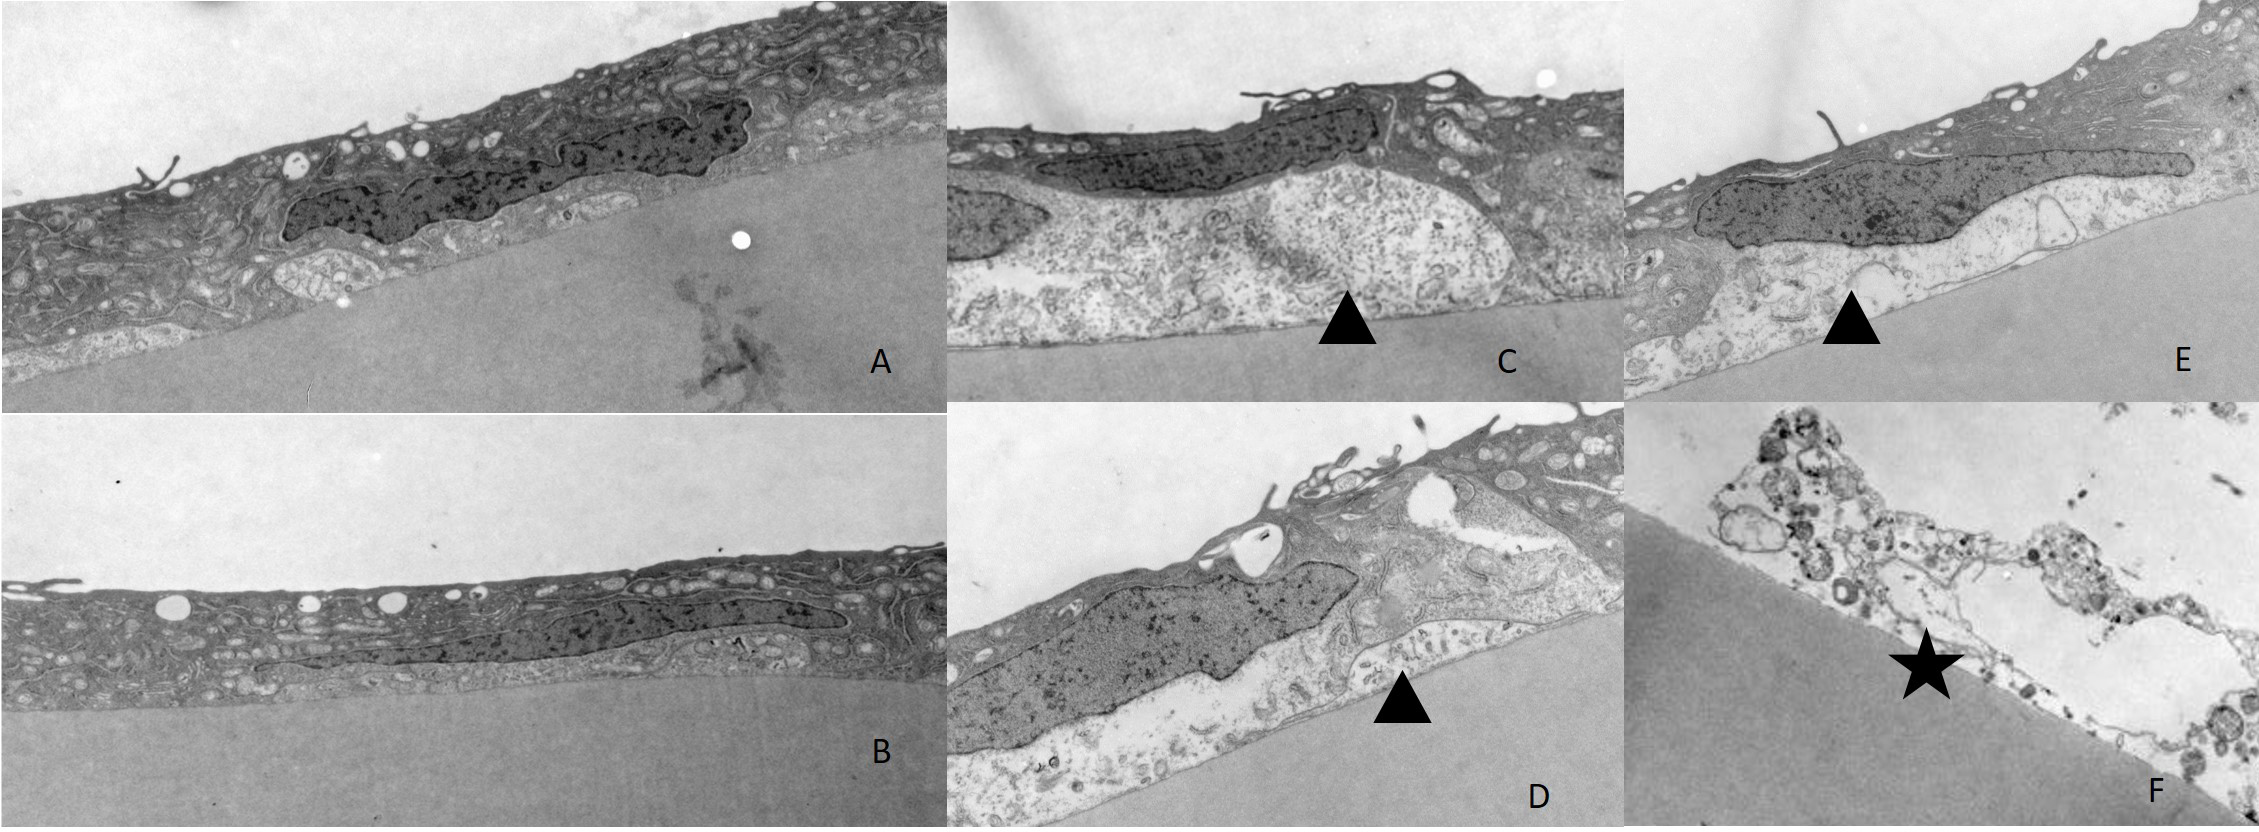
 Figure 5 of
Song, Mol Vis 2017; 23:504-513.
Figure 5 of
Song, Mol Vis 2017; 23:504-513.