Figure 7. Micropatterning results. A: Formation of varying concentrations of ARPE-19 cell with a free edge by micropatterning. Black = average number of cells
per cell patch of corresponding size; red = concentration of cells losing cell–cell contact at least on one side. Increase
in the concentration of cells losing cell–cell contact correlates negatively with cell count and patch size. Data represent
the mean ± standard deviation for three replicates (seven measurements per replicate for each pattern size and each time point;
n = 21). Similar results were seen for the human RPE (hRPE) cells (data not shown). B: Increase in the cell patch diameter at day 2. A greater increase in patch diameter was observed for the ARPE-19 cells compared
with the hRPE cells. Data represent the mean ± standard deviation for three replicates (seven measurements per replicate for
each pattern size and each time point; n = 21). C, D: VEGF expression analysis with enzyme-linked immunosorbent assay (ELISA) for the micropatterned ARPE-19 (C) and hRPE (D) cells. VEGF expression is presented as the total VEGF divided by the cell count. The smaller the pattern size, the higher
the VEGF expression per cell. VEGF expression decreased during day 2 presumably because of the increased pattern sizes due
to cell growth (B). Data represent the mean ± standard deviation for three replicates (three measurements per replicate for each pattern size
and each time point; n = 9); * p<0.05, ** p<0.01, *** p<0.001. P values are relative to the control (confluent) samples.
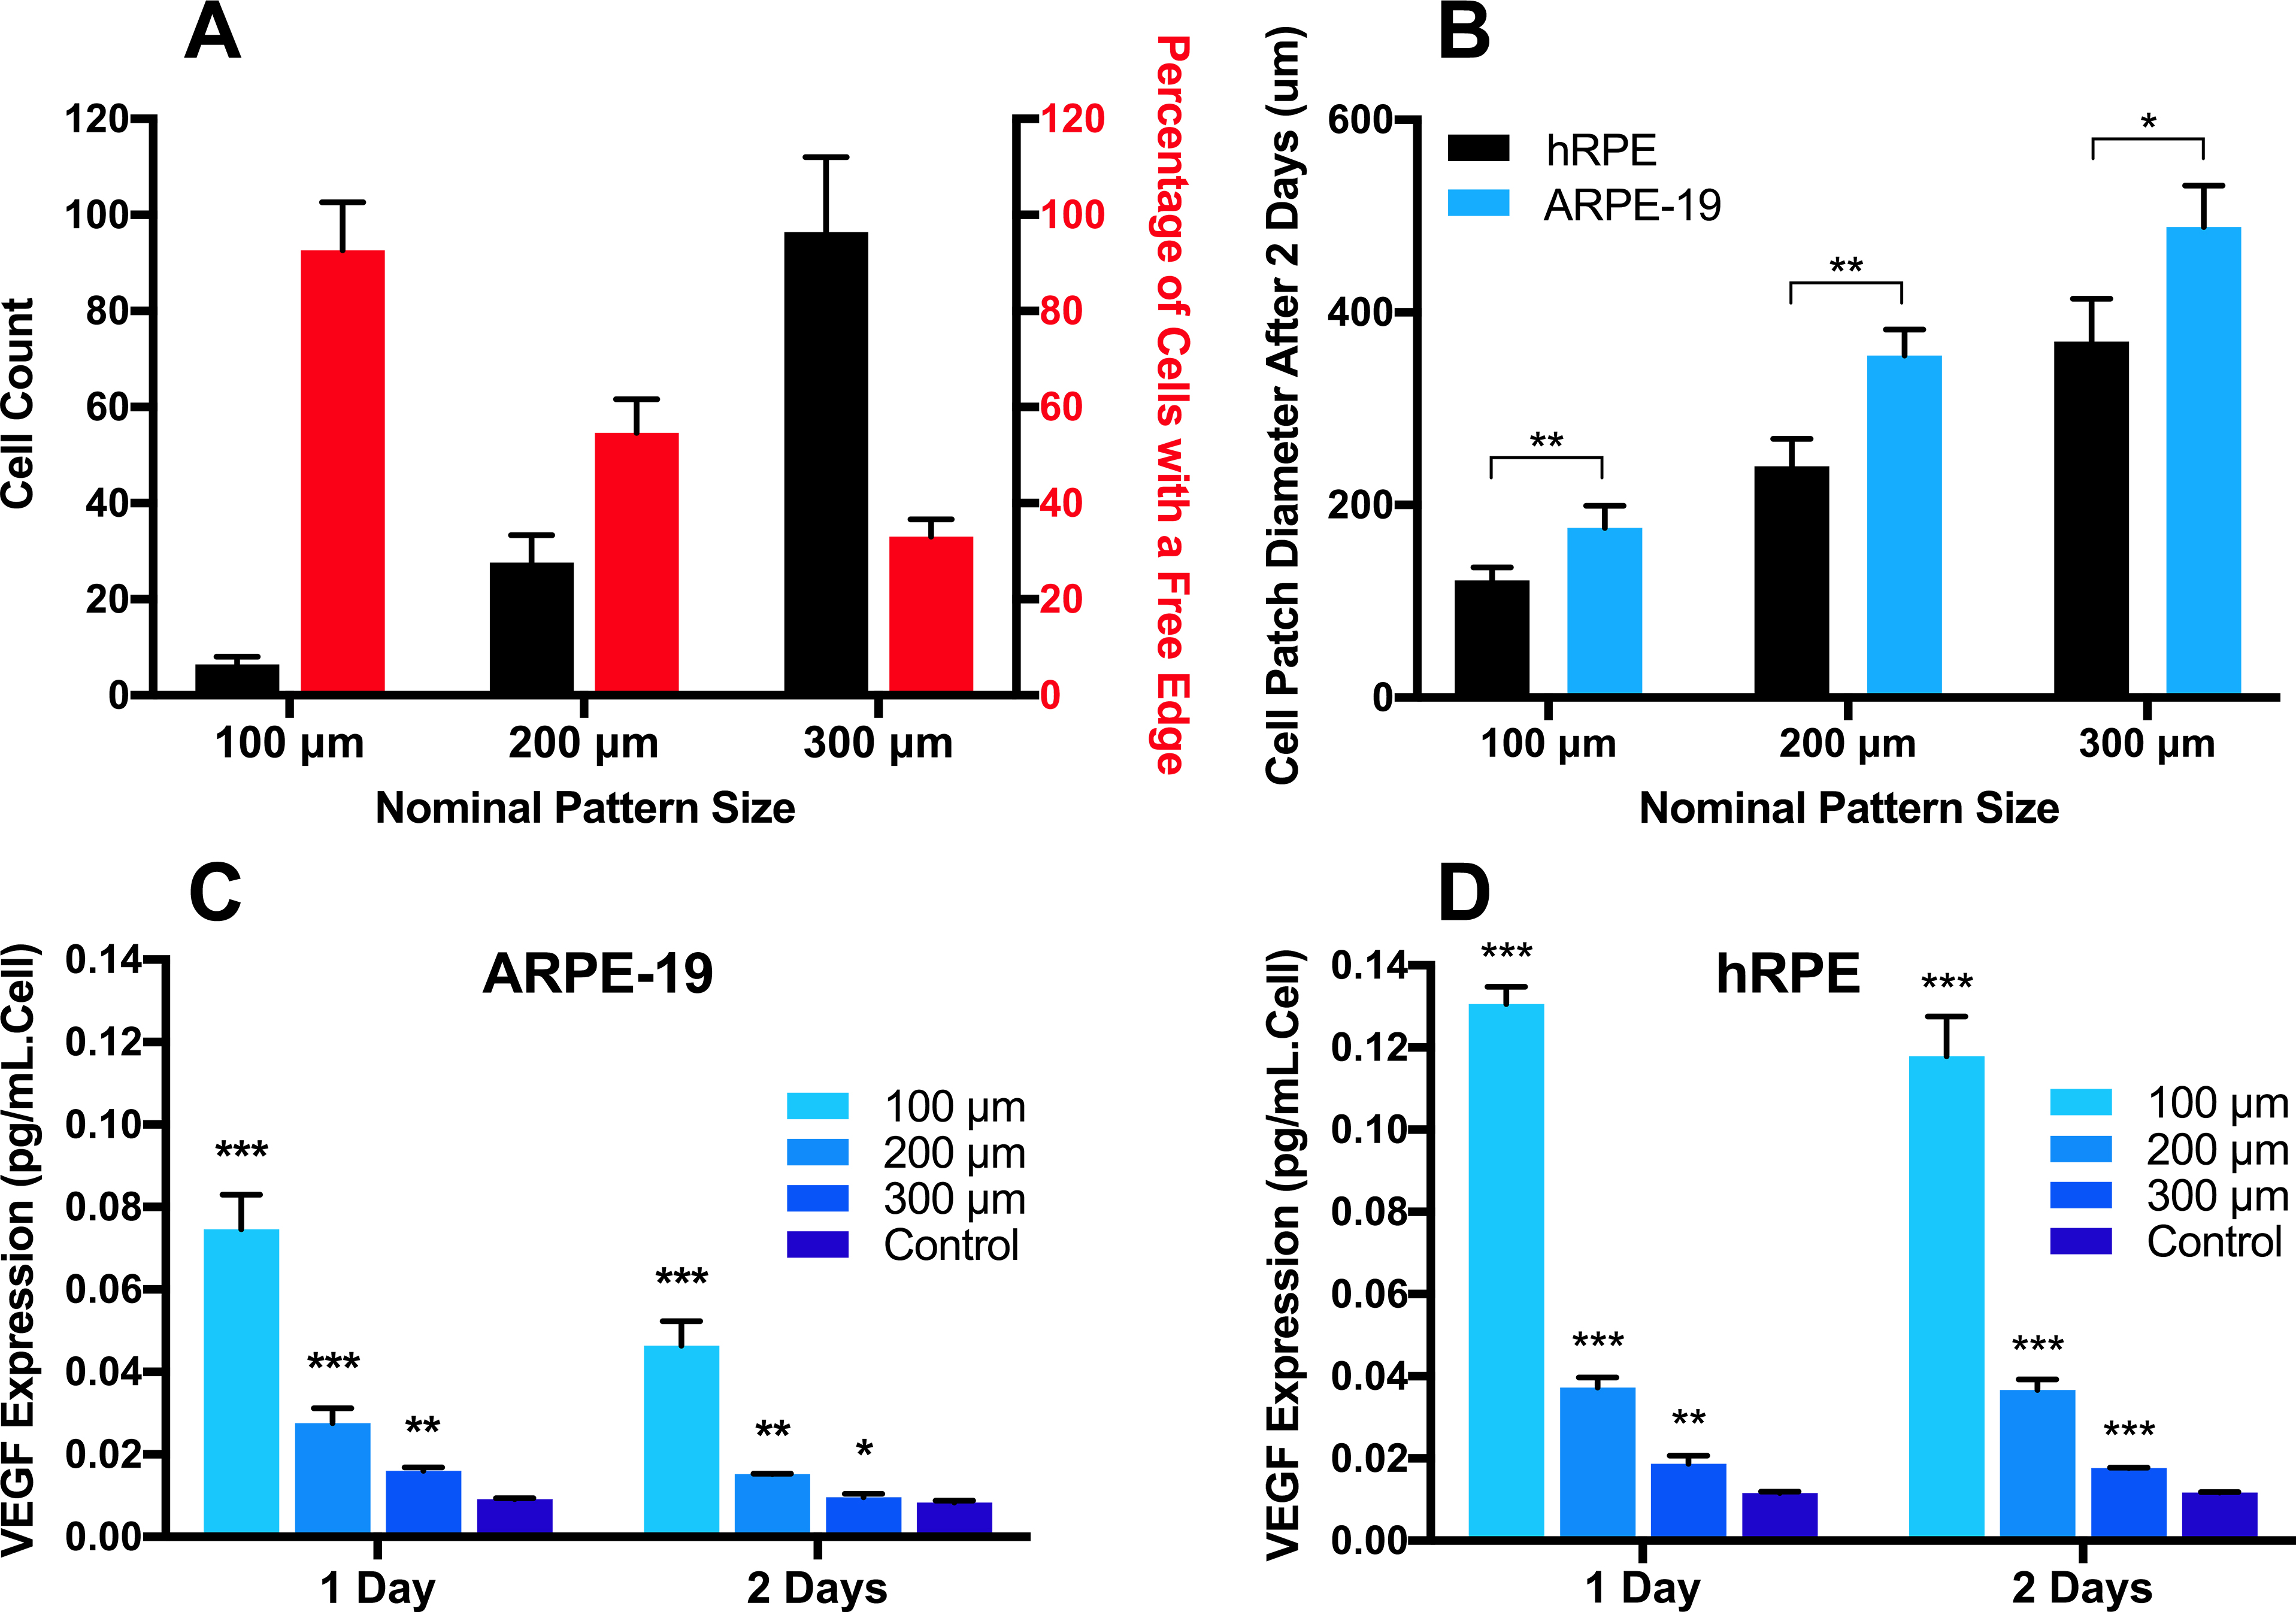
 Figure 7 of
Farjood, Mol Vis 2017; 23:431-446.
Figure 7 of
Farjood, Mol Vis 2017; 23:431-446.