Figure 2. ICC results for scratched cultures of ARPE-19 and hRPE cells. Results show confocal images for short-term (1 day after confluency)
and long-term (4 weeks after confluency) cultures of ARPE-19 (A-C, E-G) and hRPE (I-K, M-O) cells. VEGF expression was elevated along the edges of scratched areas in all sample types. Graphs D, H, L, and P show net signal intensity for VEGF along the length of the relevant confocal image (line graphs) and the average VEGF signal
intensity at 0-100 μm and 100-200 μm from the scratched edge (bar graphs). The net signal intensity was higher proximal to
the scratch zone and lower in confluent areas for all samples. The average signal intensity was higher in the first 100 μm
from the scratch edge for all samples. Blue = 4',6-diamidino-2-phenylindole (DAPI); red = VEGF. Yellow lines indicate the
scratch edge. Scale bars = 100 μm.
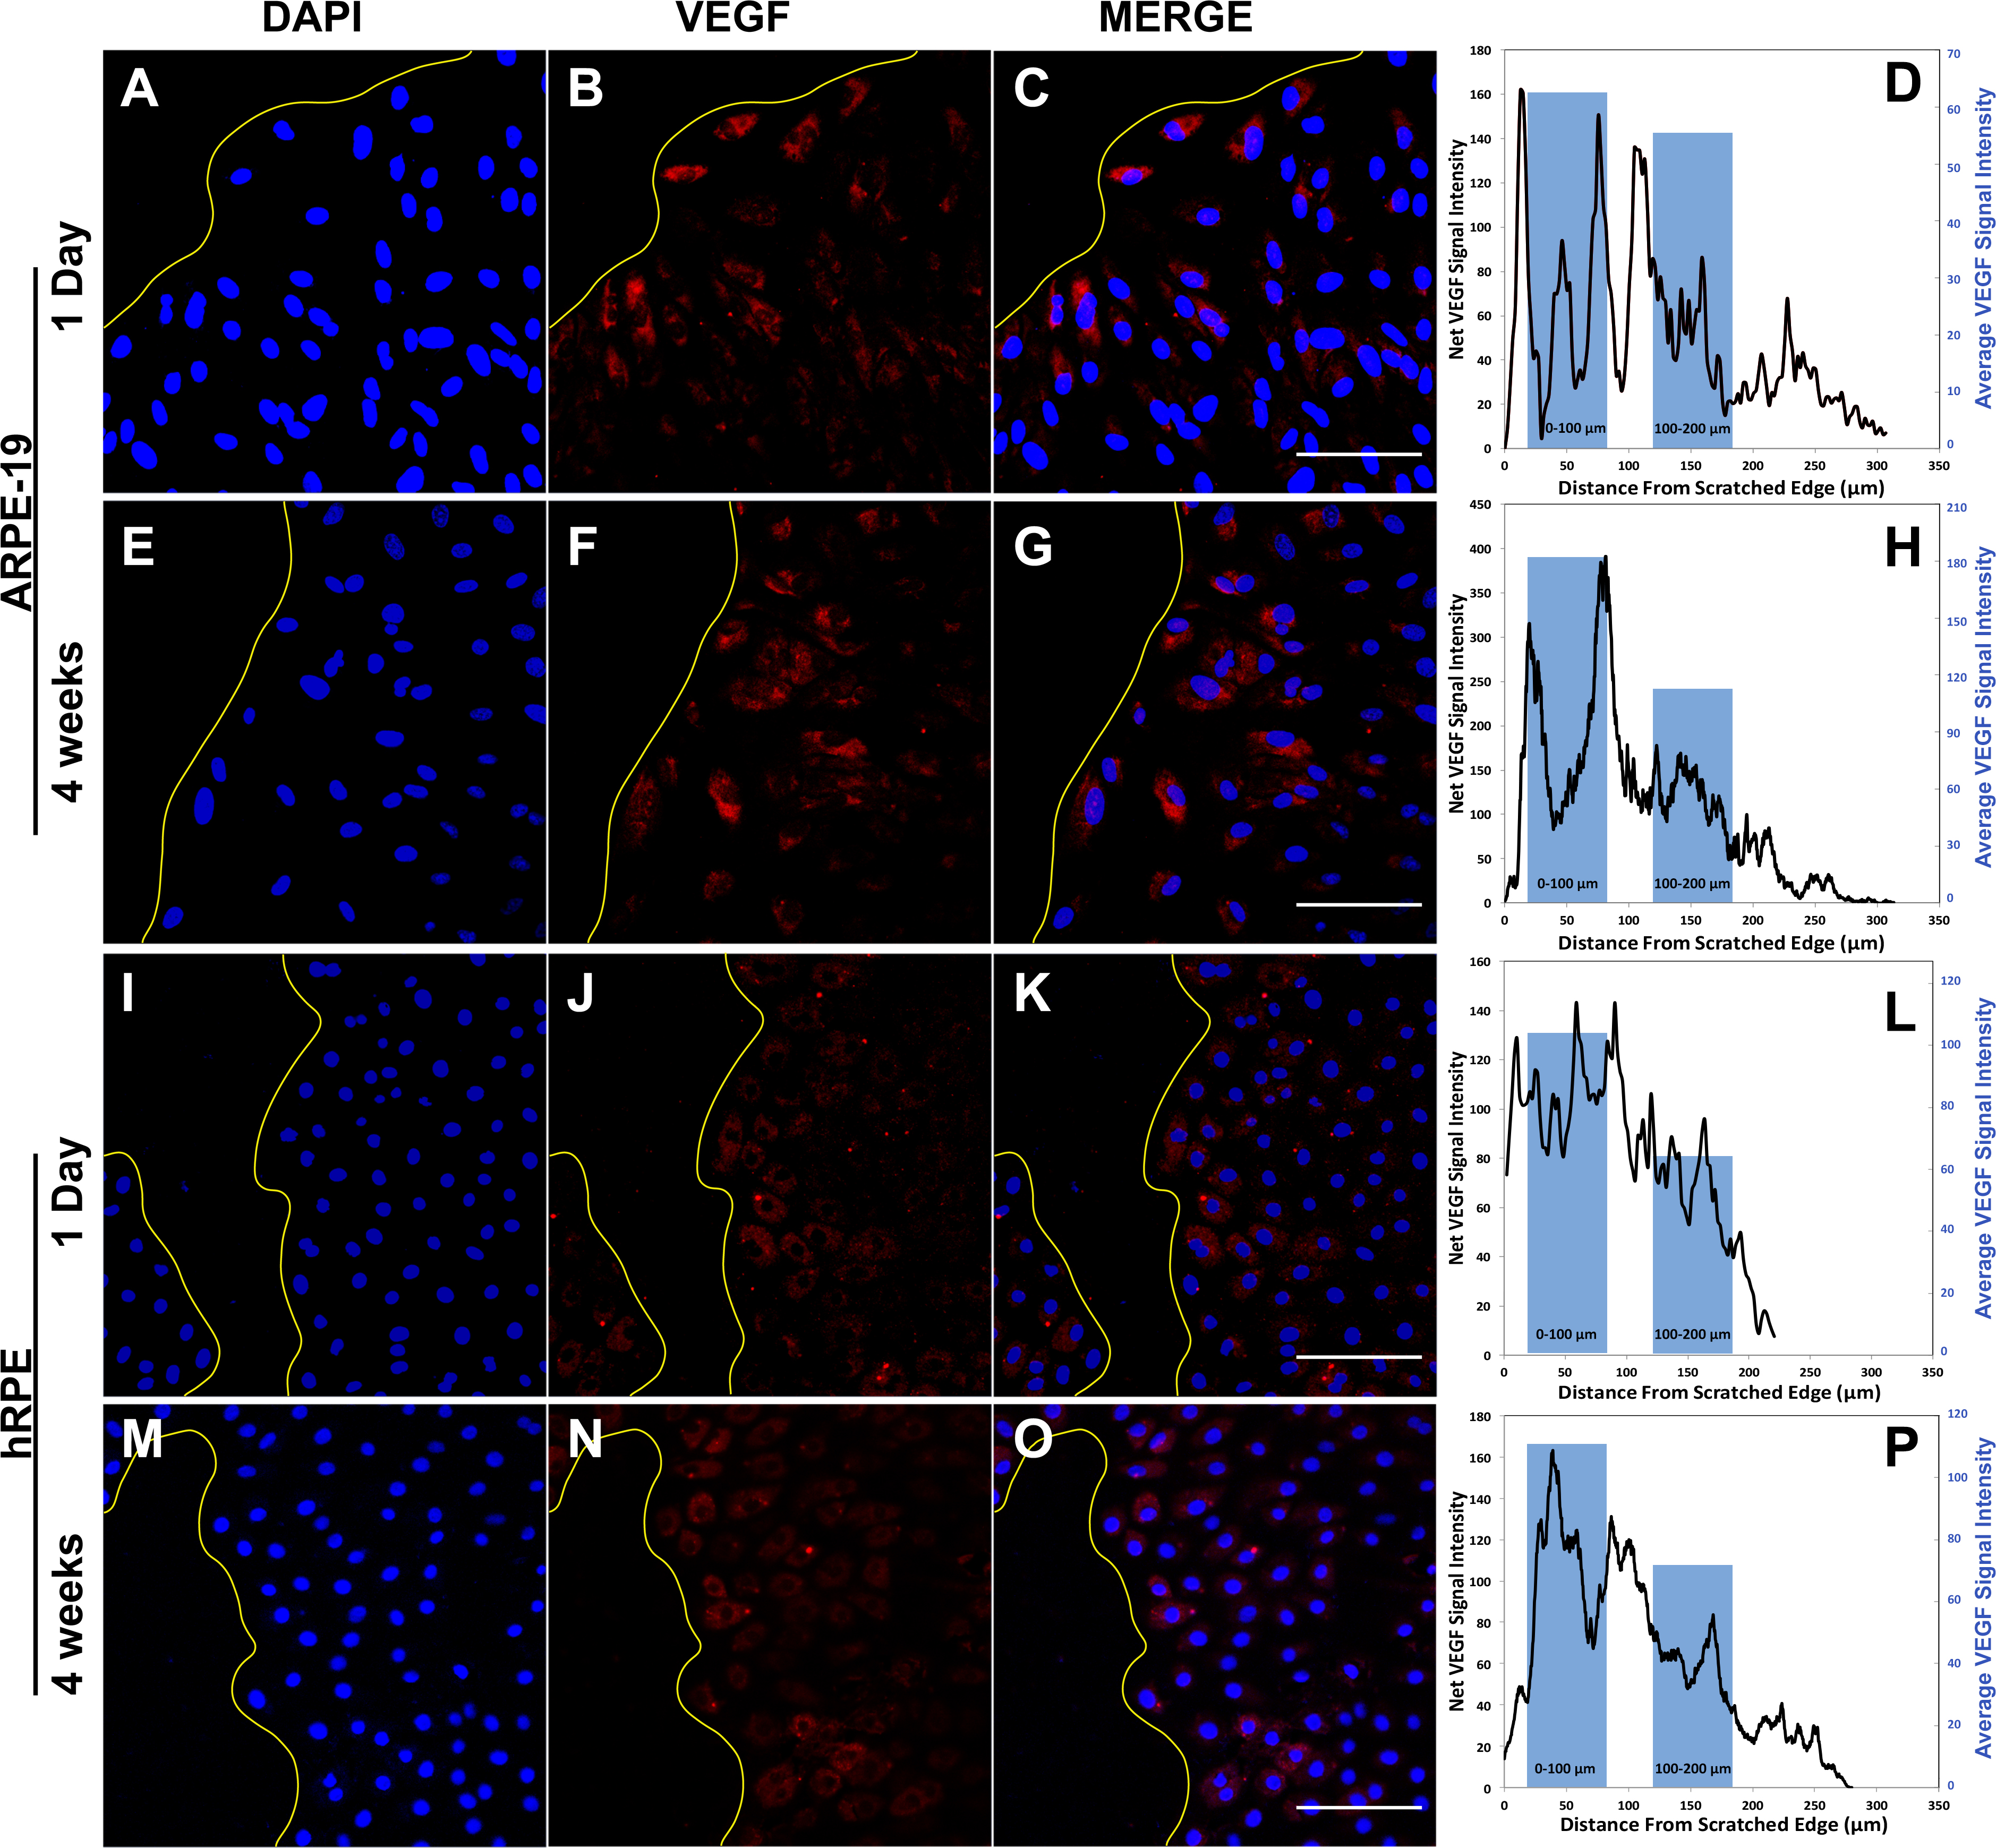
 Figure 2 of
Farjood, Mol Vis 2017; 23:431-446.
Figure 2 of
Farjood, Mol Vis 2017; 23:431-446.