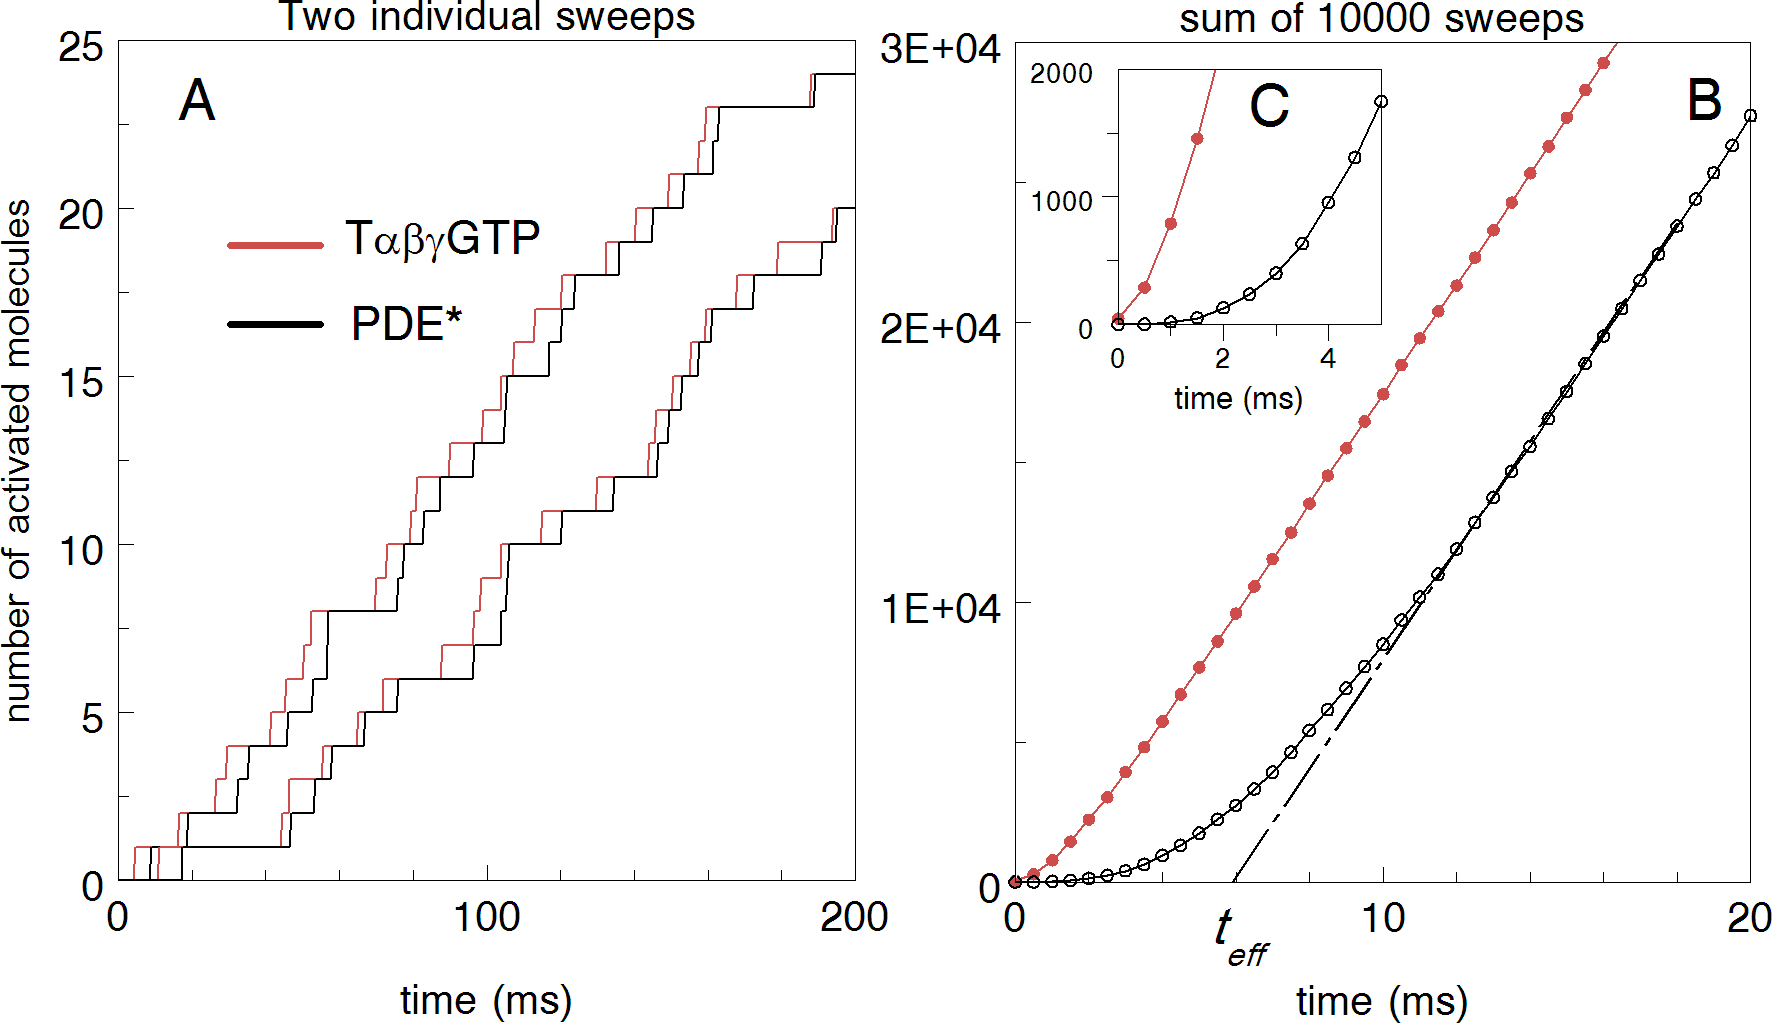
Figure 4. Time courses of active transducin (
T*) and phosphodiesterase (
PDE*) determined with a stochastic simulation.
A: Two independent repetitive cycles of reactions show the time course of accumulated concentrations of
Tαβγ-GTP and
PDE* after the activation of single rhodopsin.
B: The whole cycle is repeated 10,000 times to get the result summed over many quanta. Time constants (in ms) are
t0 = 1,
t1 = 4.7,
t2 = 0.1,
t3 = 0.1,
t4 = 0.1. Total duration of the activation cycle (
t1 +
t2 +
t3 +
t4 = 5 ms) was fixed according to biochemical data on the rate of T activation in frog rods (about 200 s
−1 [
19]).
t5 = 2.5;
t6 = 2.5.
t0 is the time of Meta II production in frog rods [
17].
 Figure 4 of
Rotov, Mol Vis 2017; 23:416-430.
Figure 4 of
Rotov, Mol Vis 2017; 23:416-430.