Figure 6. The top 20 enriched upregulated and the top 20 enriched downregulated KEGG pathways in the LPS group compared with the control
group. The top 20 upregulated and the top 20 downregulated Kyoto Encyclopedia of Genes and Genomes (KEGG) pathways of the
differentially expressed genes (DEGs) in the lipopolysaccharide (LPS) group compared with the control group. Enriched pathways
with an adjusted p value of less than 0.05 were considered significantly enriched (*adjusted p<0.05).
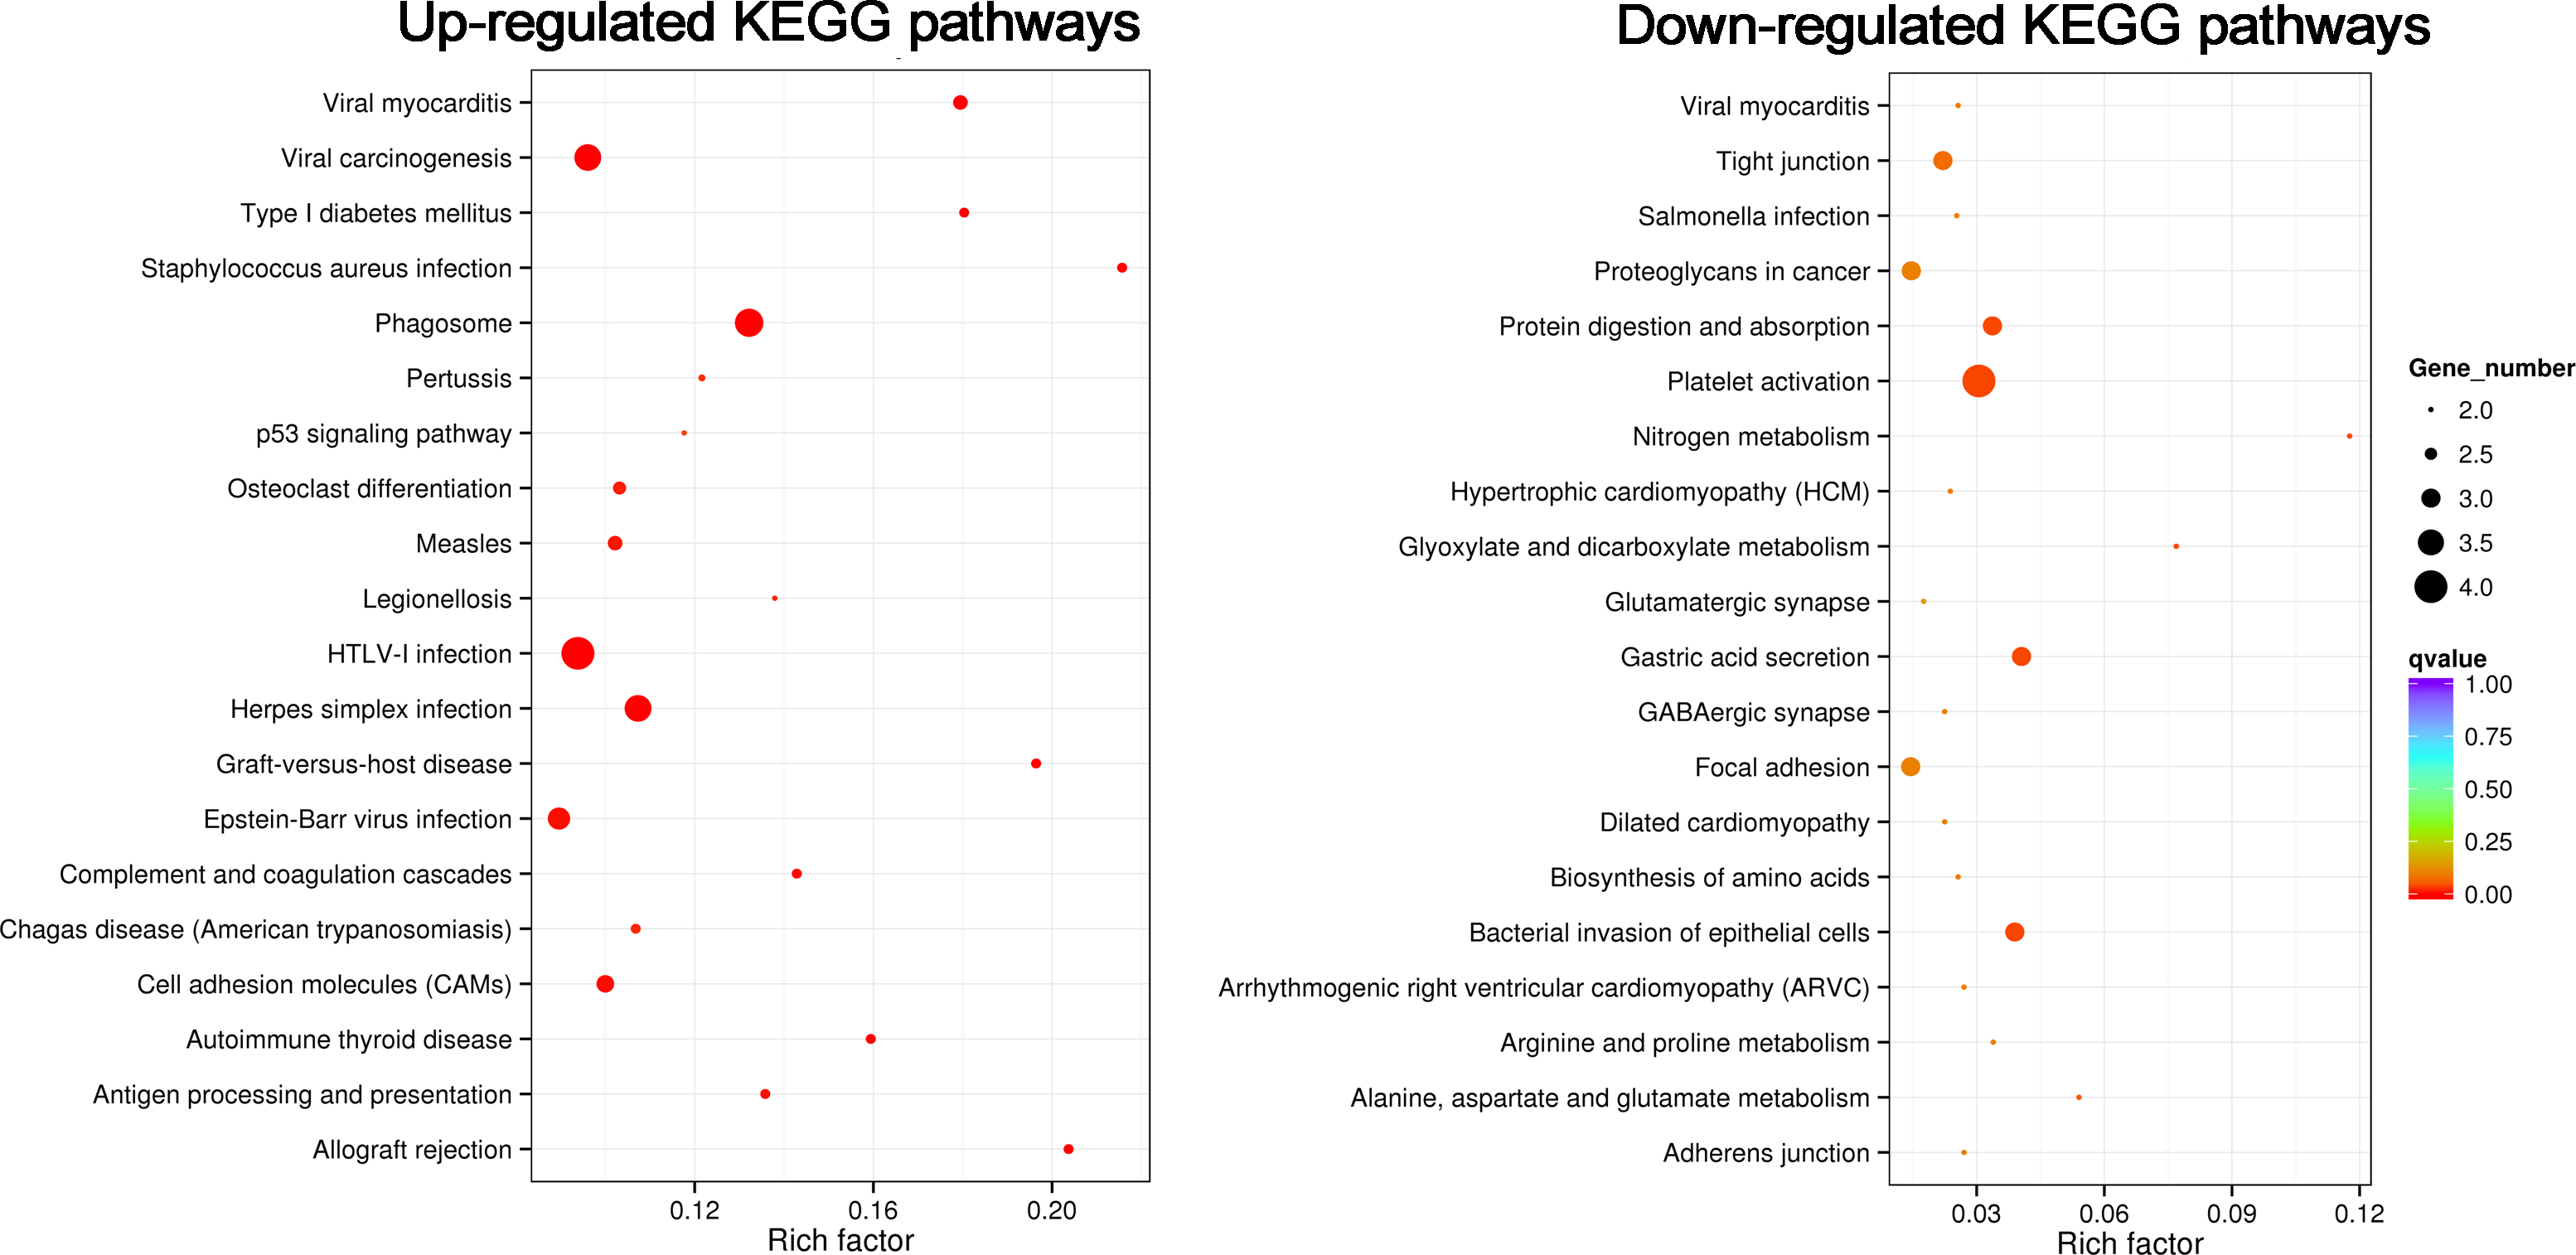
 Figure 6 of
Qiu, Mol Vis 2017; 23:395-406.
Figure 6 of
Qiu, Mol Vis 2017; 23:395-406.