Figure 5. The top 30 enriched upregulated and the top 30 enriched downregulated GO terms in the LPS group compared with the control
group. The top 30 upregulated and the top 30 downregulated Gene Ontology (GO) terms in the lipopolysaccharide (LPS) group
compared to the control group. Enriched GO terms with an adjusted p value of less than 0.05 were considered significantly
enriched (*adjusted p<0.05).
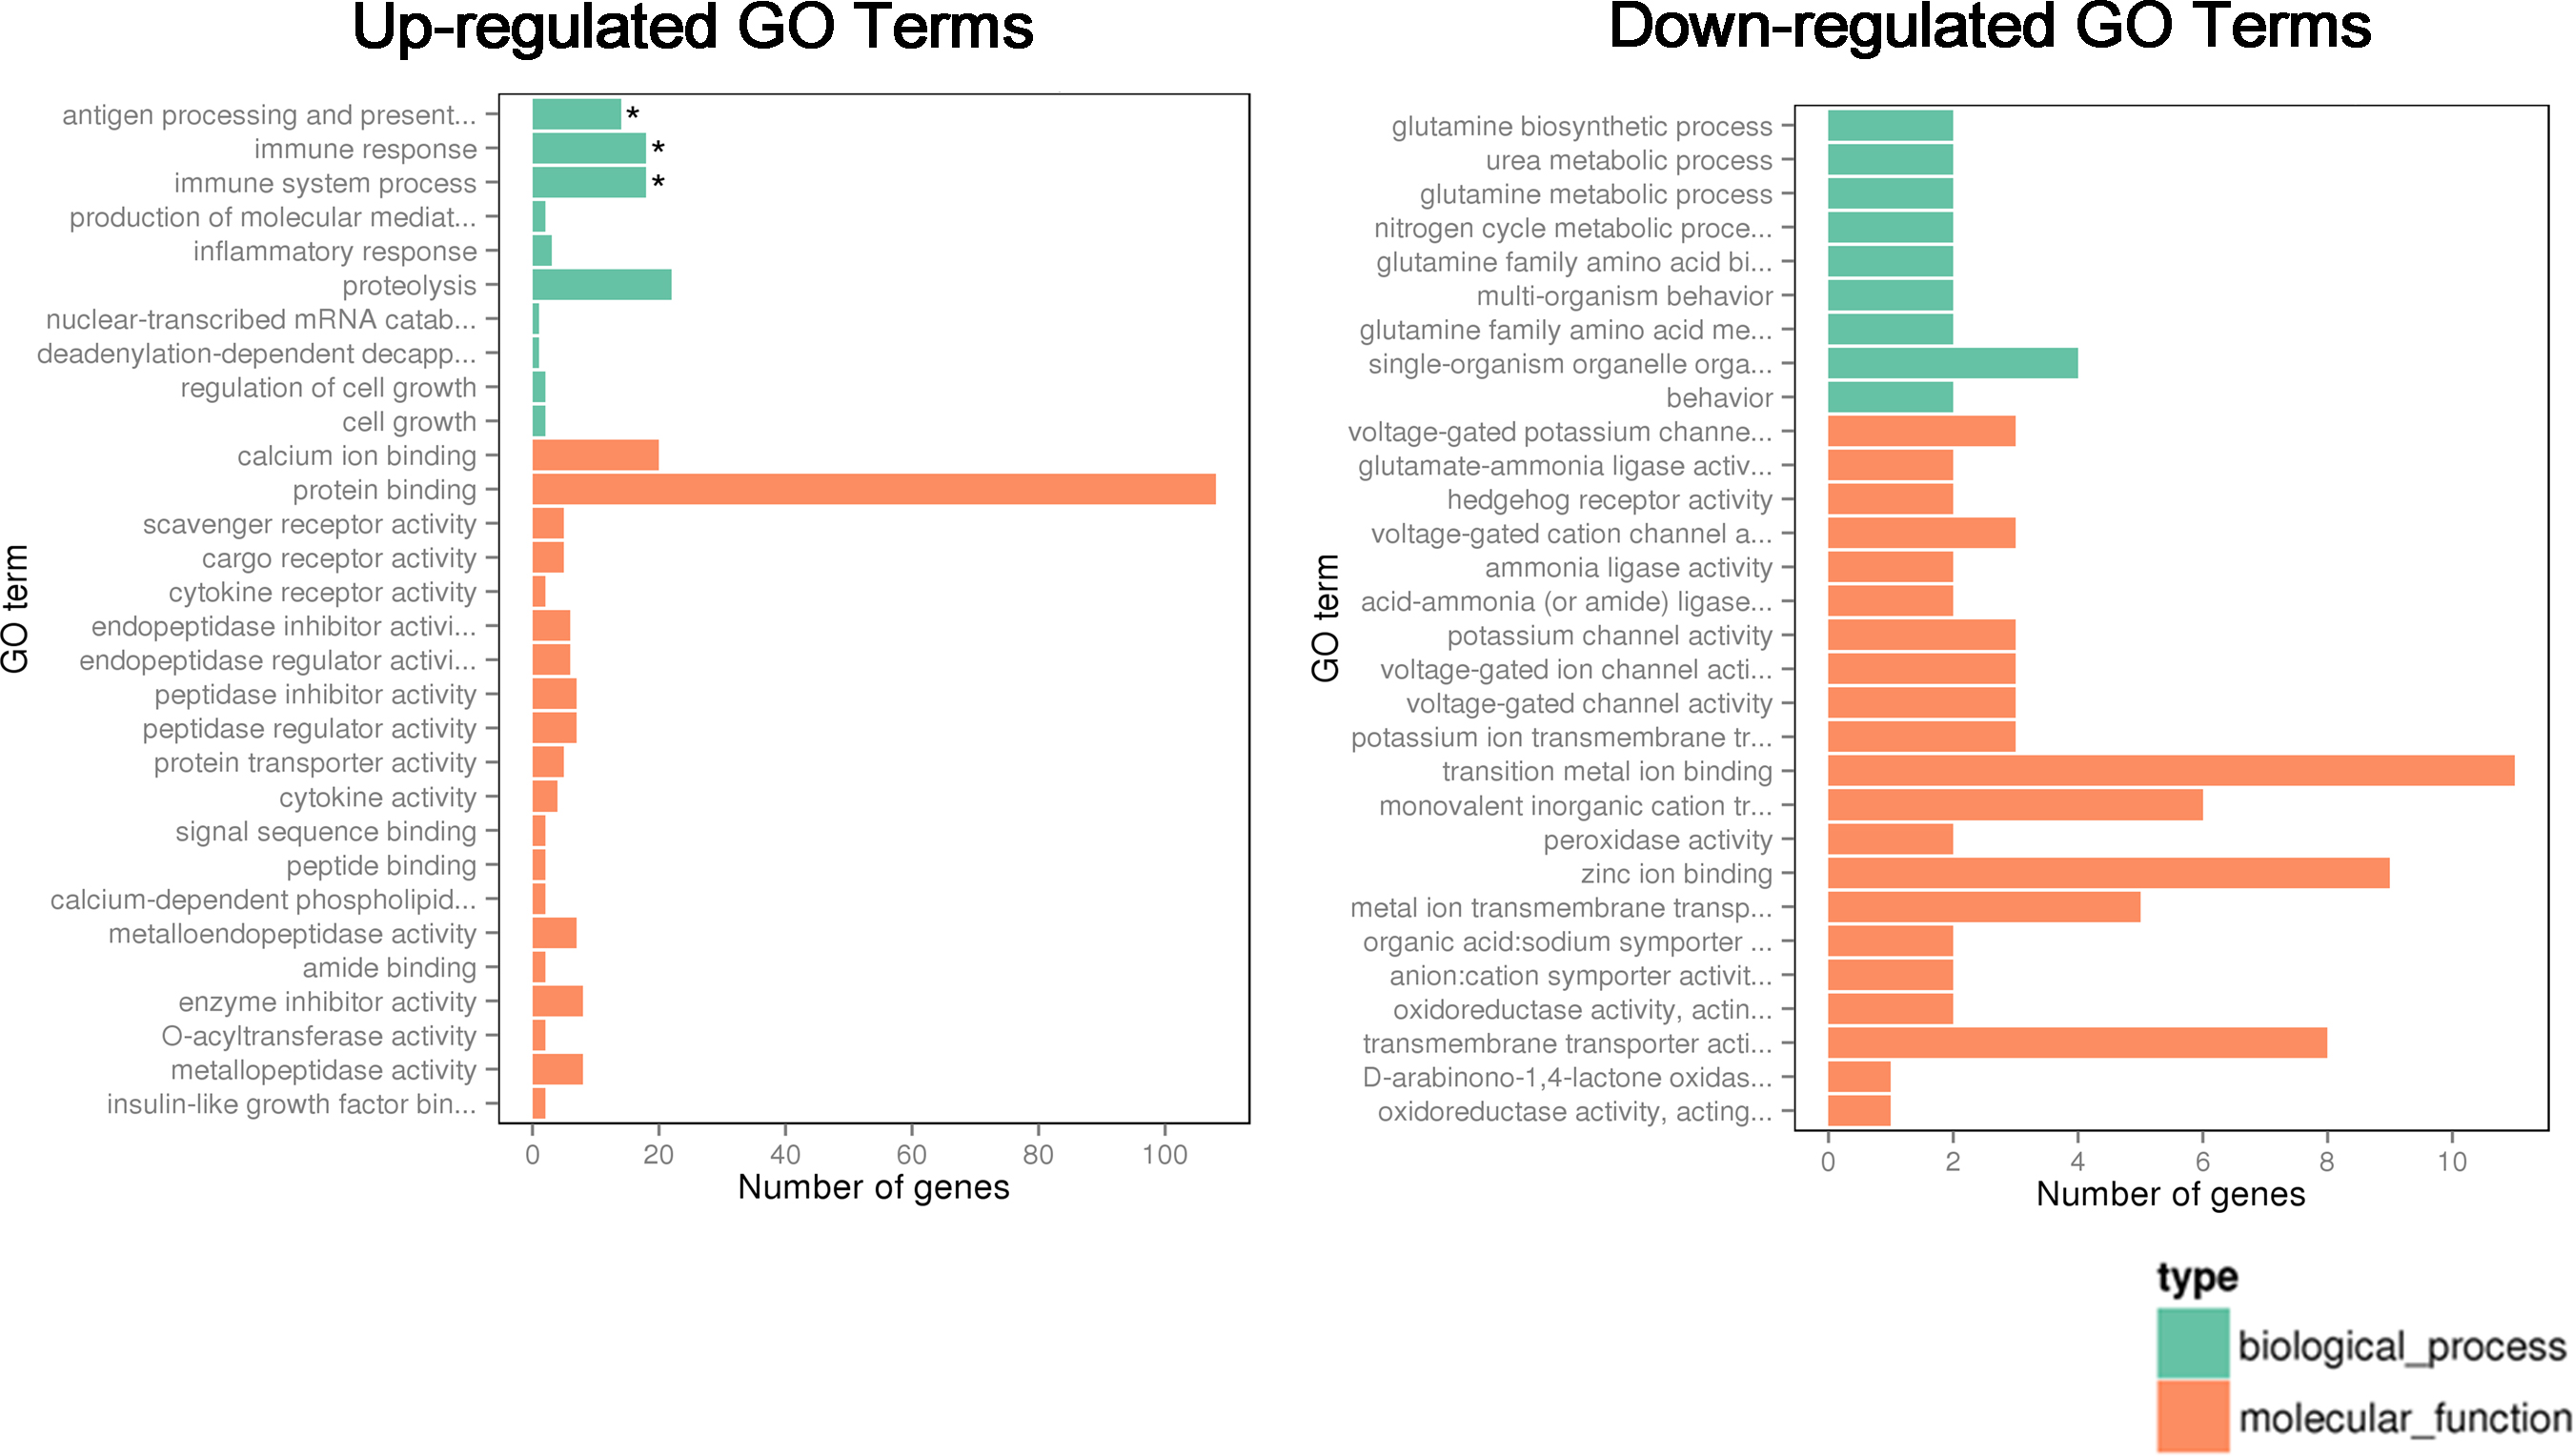
 Figure 5 of
Qiu, Mol Vis 2017; 23:395-406.
Figure 5 of
Qiu, Mol Vis 2017; 23:395-406.