Figure 3. Hierarchical cluster analysis of the retinas between the EIU mice and the control mice. The cluster analysis displays gene
expression changes in the retinas of the lipopolysaccharide (LPS)-treated mice and the control mice. Gene expression profiles
of the control mice that received sham injection with PBS in each eye (C1–3, n = 3) were compared with the endotoxin-induced
uveitis (EIU) mice that received a single intravitreal injection with LPS in each eye (L1–3, n = 3). Red bars indicate increased
expression, and blue bars indicate decreased expression.
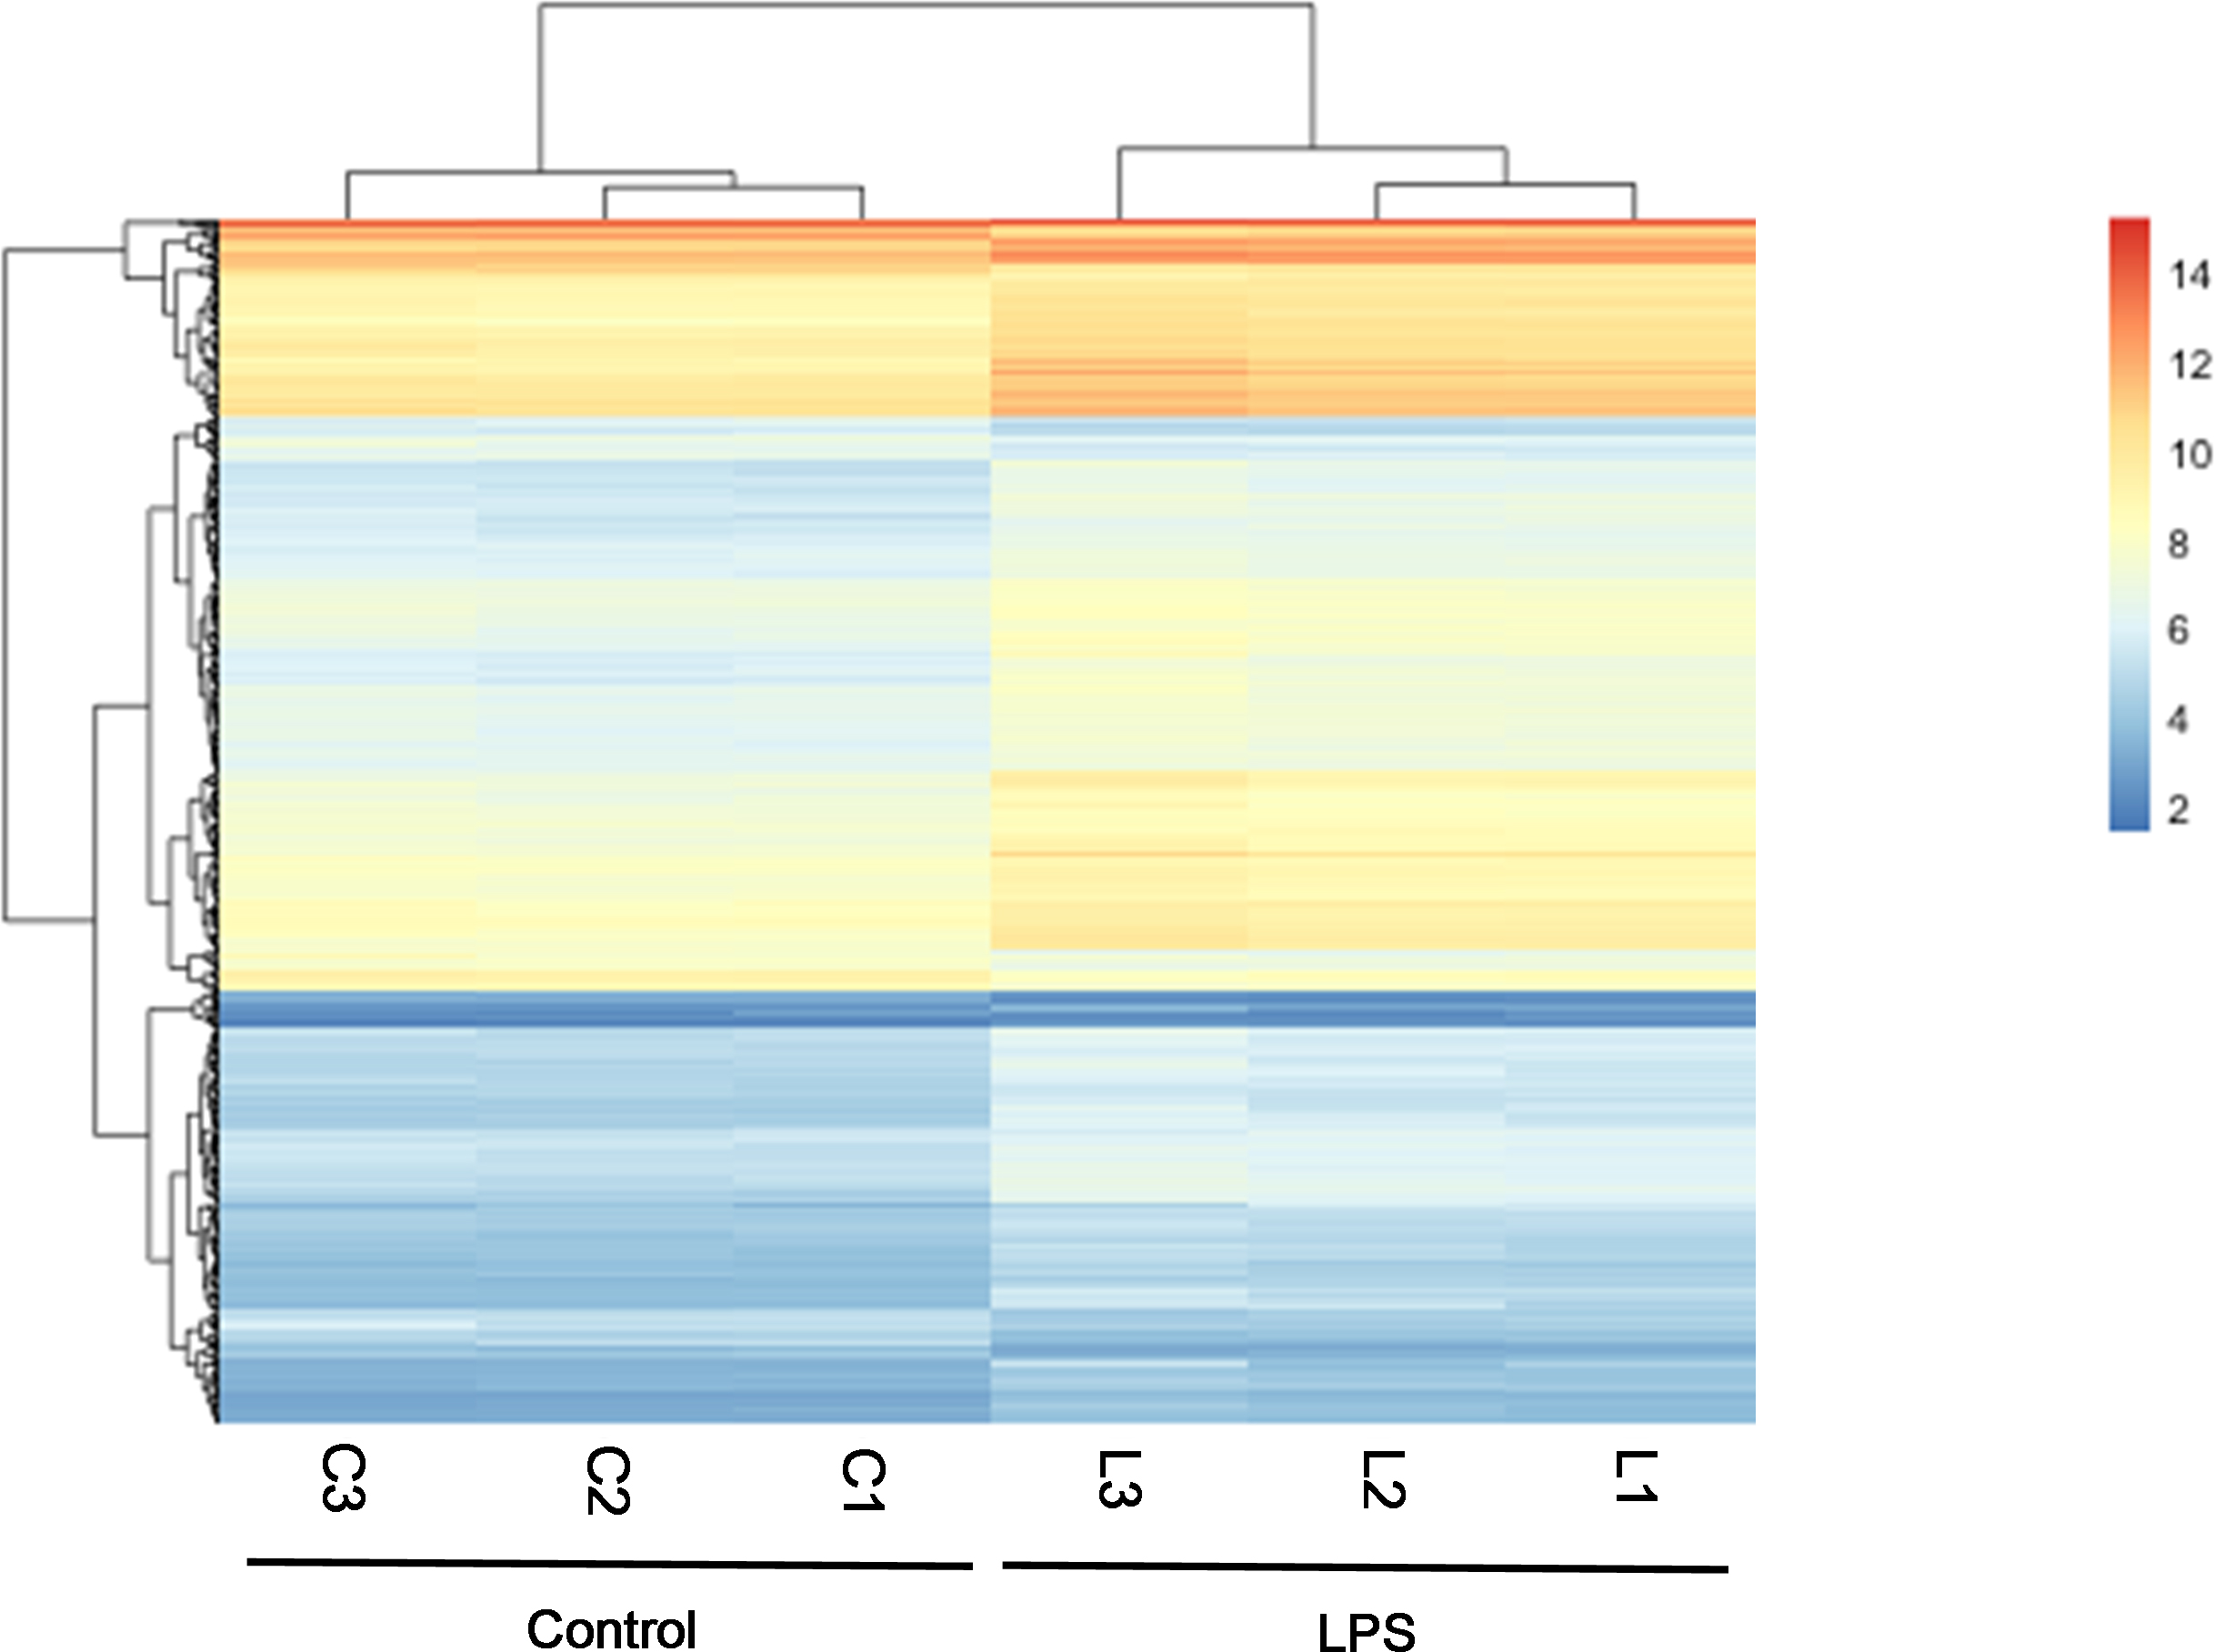
 Figure 3 of
Qiu, Mol Vis 2017; 23:395-406.
Figure 3 of
Qiu, Mol Vis 2017; 23:395-406.