Figure 7. Antiapoptotic Bcl2 expression. Reverse-transcription PCR (RT–PCR) for Bcl2 in R28 cells treated for 6 h with PN-1, PN-1[R346A], PN-1-17mer, PEDF-44mer, PEDF-17mer, and PEDF at the indicated concentrations,
as well as with 10% fetal bovine serum (FBS; positive control) and in serum-free medium (None, untreated control). Bar graphs
depict the average Bcl2 transcript values obtained relative to their respective 18S RNA values. Shown is the average from three independent experiments (n = 2 for each experiment) each performed with a different
batch of cells. The dotted line corresponds to the value of None (untreated control), as reference, ± standard error of the
mean (SEM; error bars). *, p<0.05; **, p<0.005.
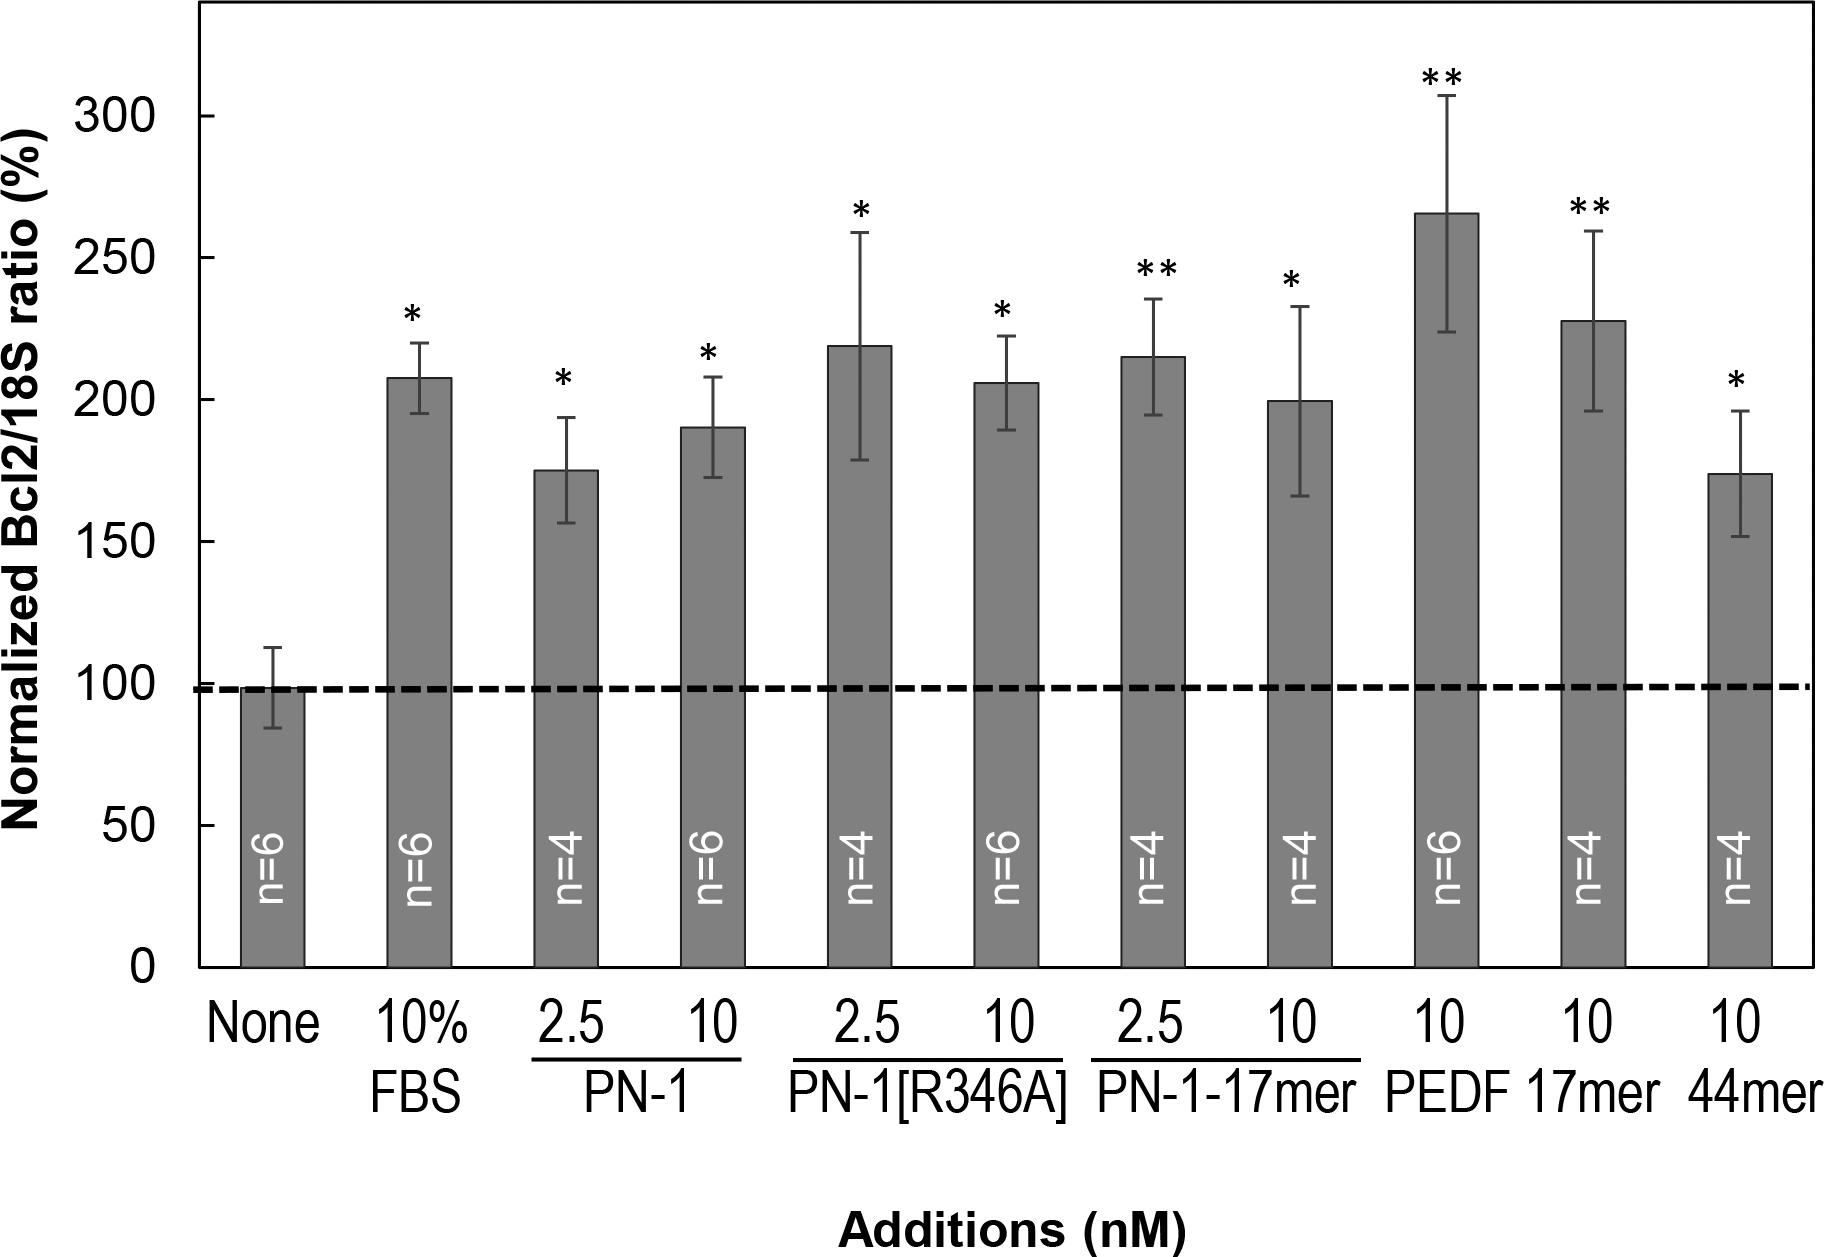
 Figure 7 of
Winokur, Mol Vis 2017; 23:372-384.
Figure 7 of
Winokur, Mol Vis 2017; 23:372-384.