Figure 2. Tertiary structure comparison. Tertiary structures of PN-1 (PDB: 4DY7_C) and PEDF (PDB: 1IMV_A) were modeled on the Cn3D macromolecular
structure viewer (Version 4.3). Alpha helices (pink) and beta sheets (blue) are highlighted. The 17mer region of PEDF (green)
within alpha helix C exhibits neurotrophic activity. The corresponding peptide region in PN-1 is also shown in green. The
dotted red line corresponds to the homologous serpin reactive center loop (RCL).
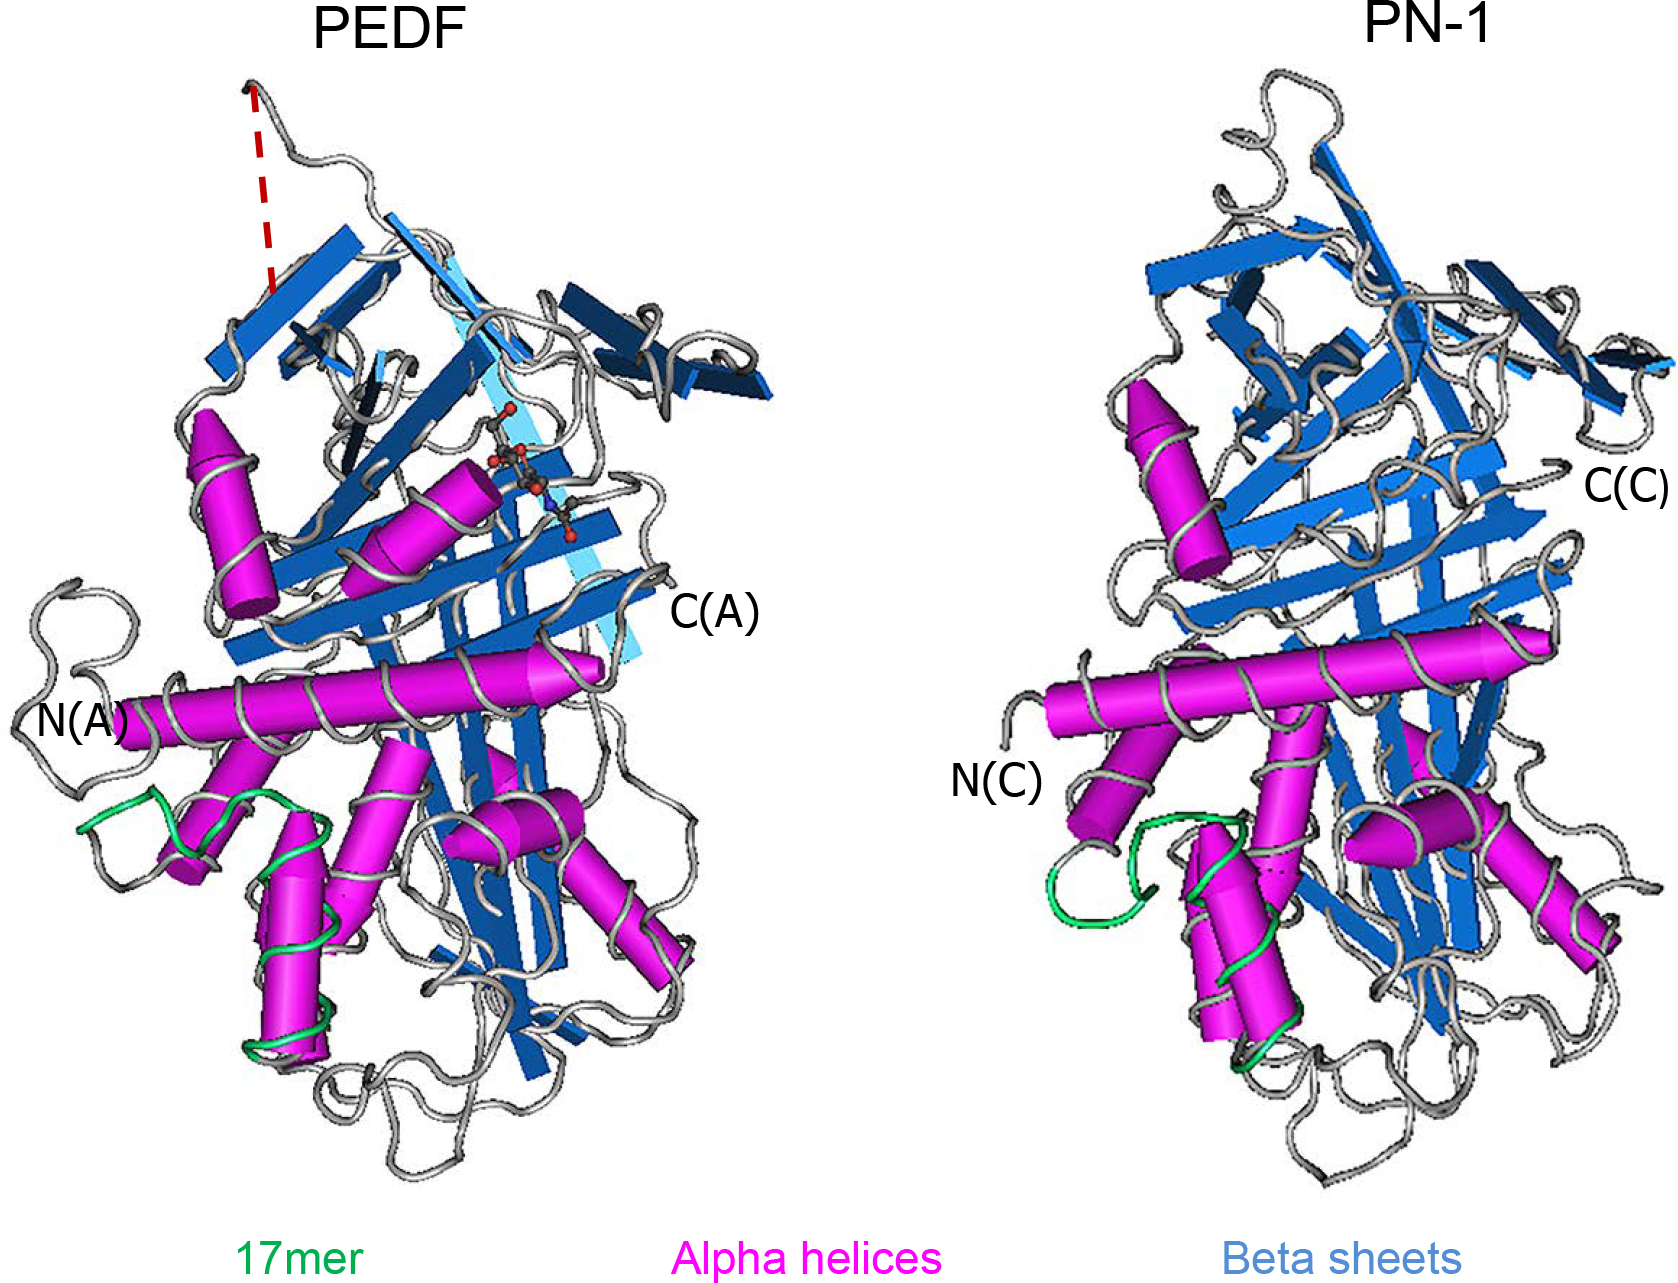
 Figure 2 of
Winokur, Mol Vis 2017; 23:372-384.
Figure 2 of
Winokur, Mol Vis 2017; 23:372-384.