Figure 1. Box whisker plot represents the distributional difference of VEGF165a-b (pg/ml) among the different phenotypes (grades or severity) of DR. Plasma concentration of VEGF165a-b consistently increased during severity of the disease in significant manner (Panova<0.0001). Further Tukey's Multiple Comparison Test revealed that VEGF165a-b significantly elevated among Diffuse DME with SNPDR (C) and PDR (D) compared to Focal DME with MNPDR (A), Ptukeys <0.001 (A vs C) and Ptukeys <0.0001 (A vs D). Diffuse DME with PDR (D) further significantly elevated compared to Focal DME with SNPDR(B); Ptukeys <0.001 (B vs D). Level of VEGF165a-b among Diffuse DME with PDR (D) significantly elevated compared to Diffuse DME with SNPDR (C), Ptukeys <0.01 (C vs D).Data are mean± SD, sample size (n) as indicatedin figure legend.
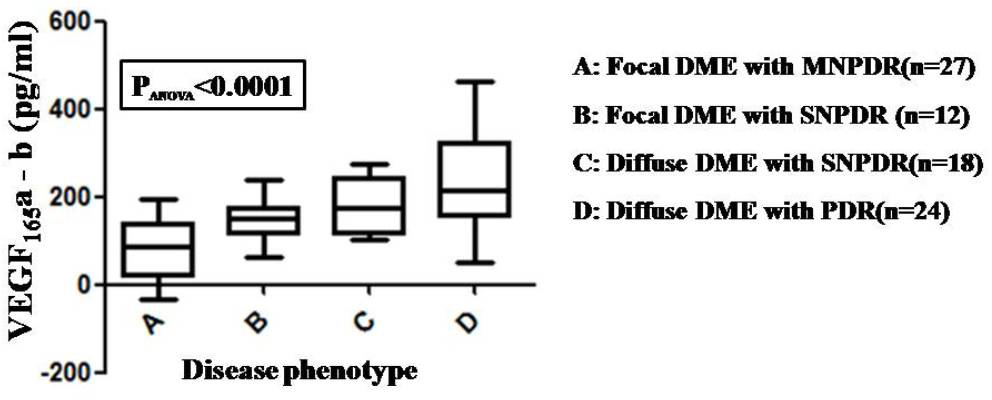
 Figure 1 of
Paine, Mol Vis 2017; 23:356-363.
Figure 1 of
Paine, Mol Vis 2017; 23:356-363.