Figure 3. The time-dependent effect of cedilanid on oxygen-induced retinal neovascularization. A: Immunofluorescence images of retinal whole mounts show the neovascular area and the obliterative area in the left eyes injected
with 0.2 μg cedilanid. B: Immunofluorescence images of retinal whole mounts show the neovascular area and the obliterative area in the corresponding
control eyes injected with PBS. Cedilanid and PBS were intravitreally injected on P15. C: Quantification of the neovascular area and the obliterative areas in eyes injected with 0.2 μg and control eyes injected
with PBS; n = 10. *p<0.05 versus PBS. D: The ratios of the neovascular areas and the obliterative areas in eyes injected with cedilanid to the corresponding control
eyes injected with PBS on P12 and P15.
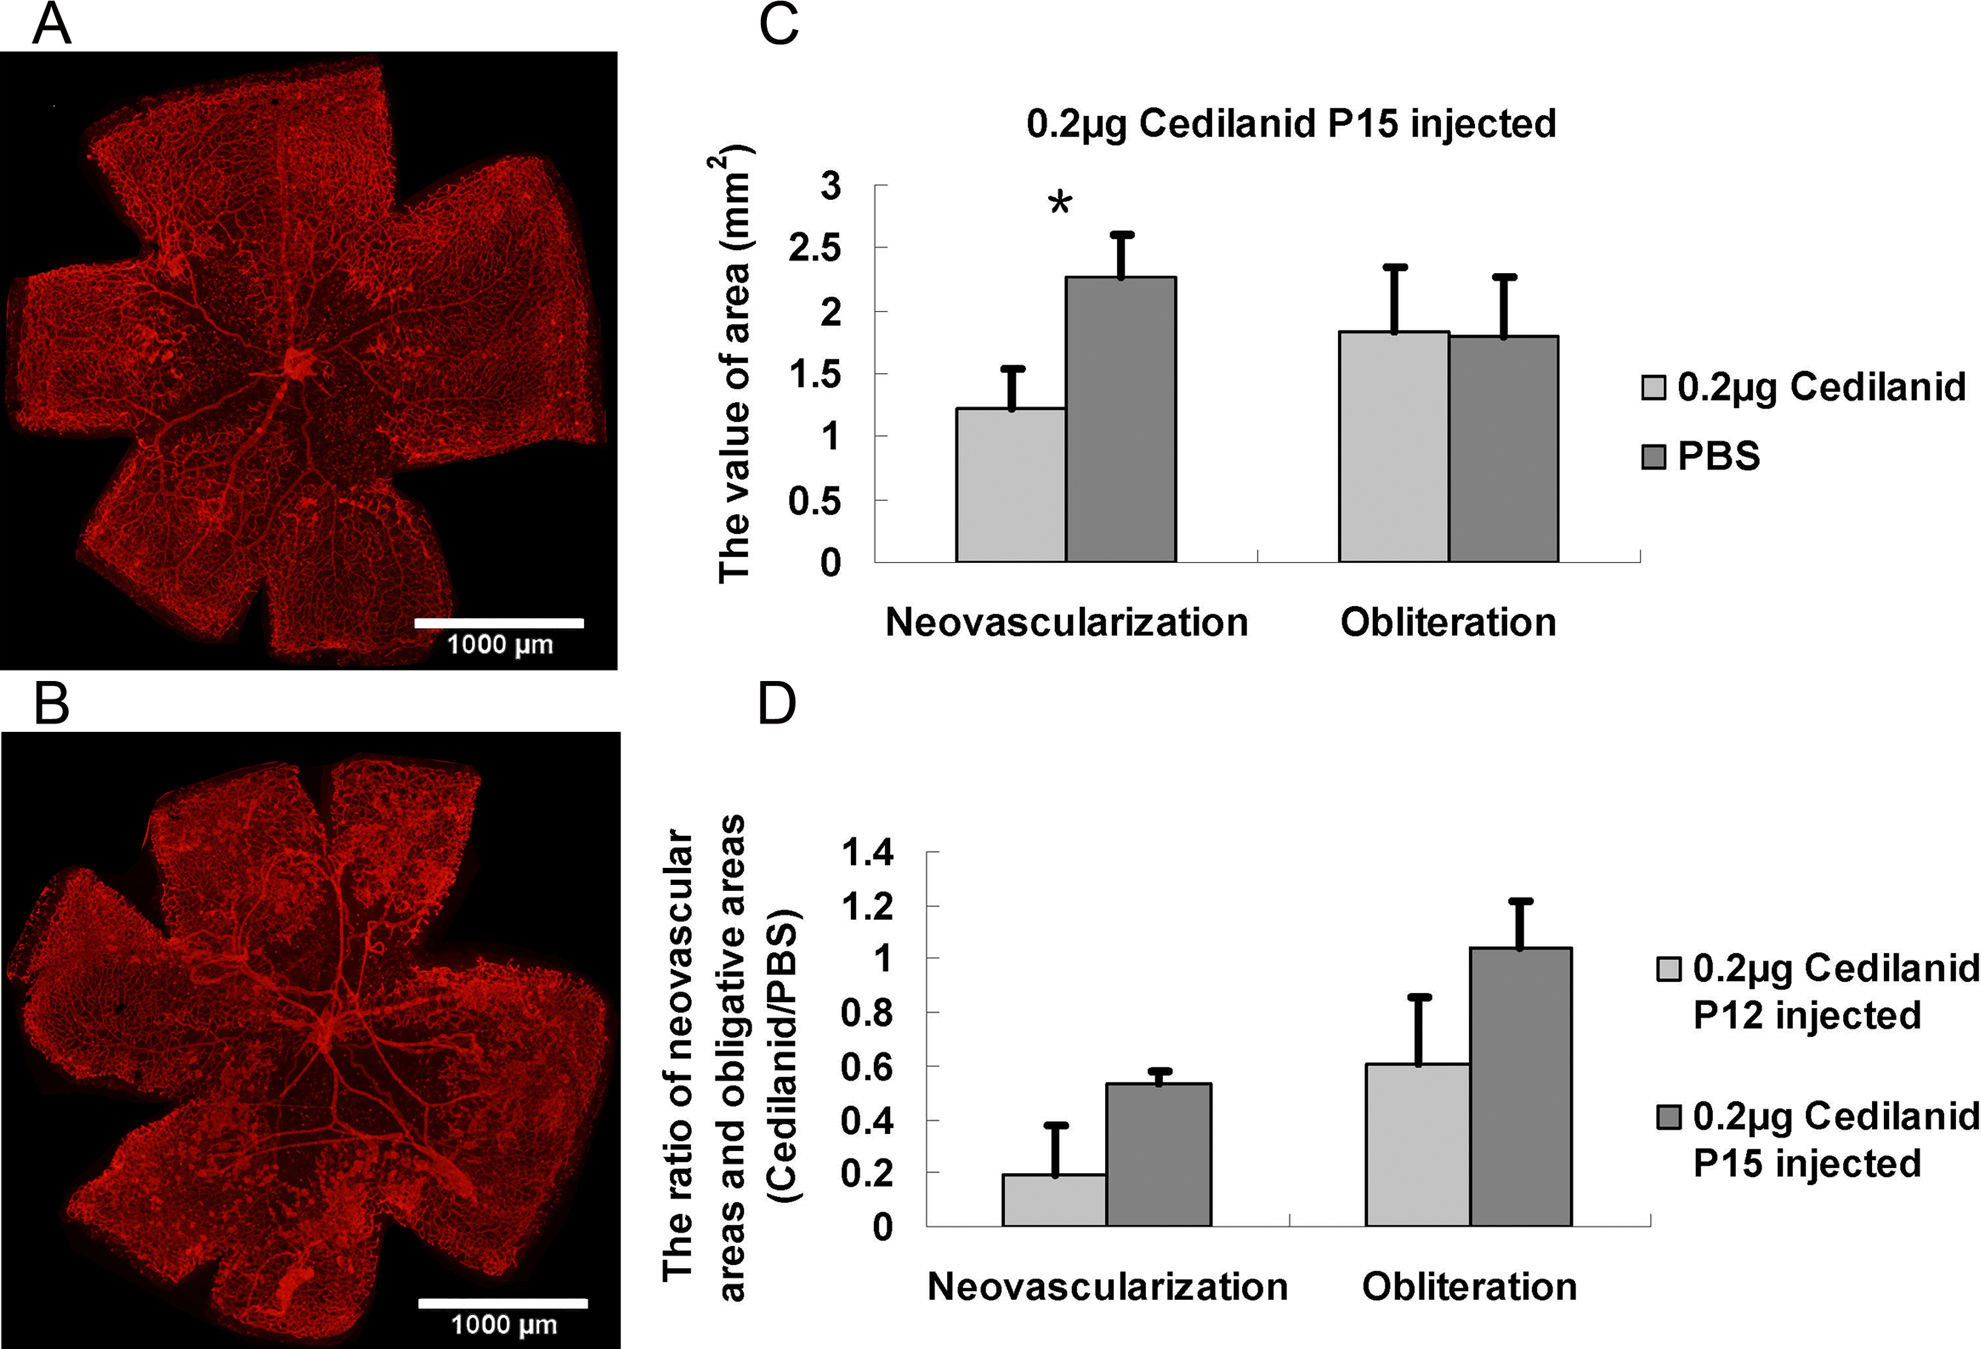
 Figure 3 of
Zhang, Mol Vis 2017; 23:346-355.
Figure 3 of
Zhang, Mol Vis 2017; 23:346-355.