Figure 2. The dose-dependent effect of cedilanid on oxygen-induced retinal neovascularization. Immunofluorescence images of retinal
whole mounts showed the neovascular area and the obliterative area in the left eyes injected with 0.025 μg (A; n = 9), 0.05 μg (D; n = 10), 0.1 μg (G; n = 10), and 0.2 μg (J; n = 8) and the corresponding control eyes injected with PBS (B, E, H, K). Cedilanid and PBS were intravitreally injected on P12. The quantification of the neovascular area and the obliterative
areas in eyes injected with 0.025 μg (C), 0.05 μg (F), 0.1 μg (I), and 0.2 μg (L) and control eyes injected with PBS. M: The ratios of the neovascular areas and the obliterative areas in eyes injected with different doses of cedilanid to the
corresponding control eyes injected with PBS. *p<0.05 versus PBS control.
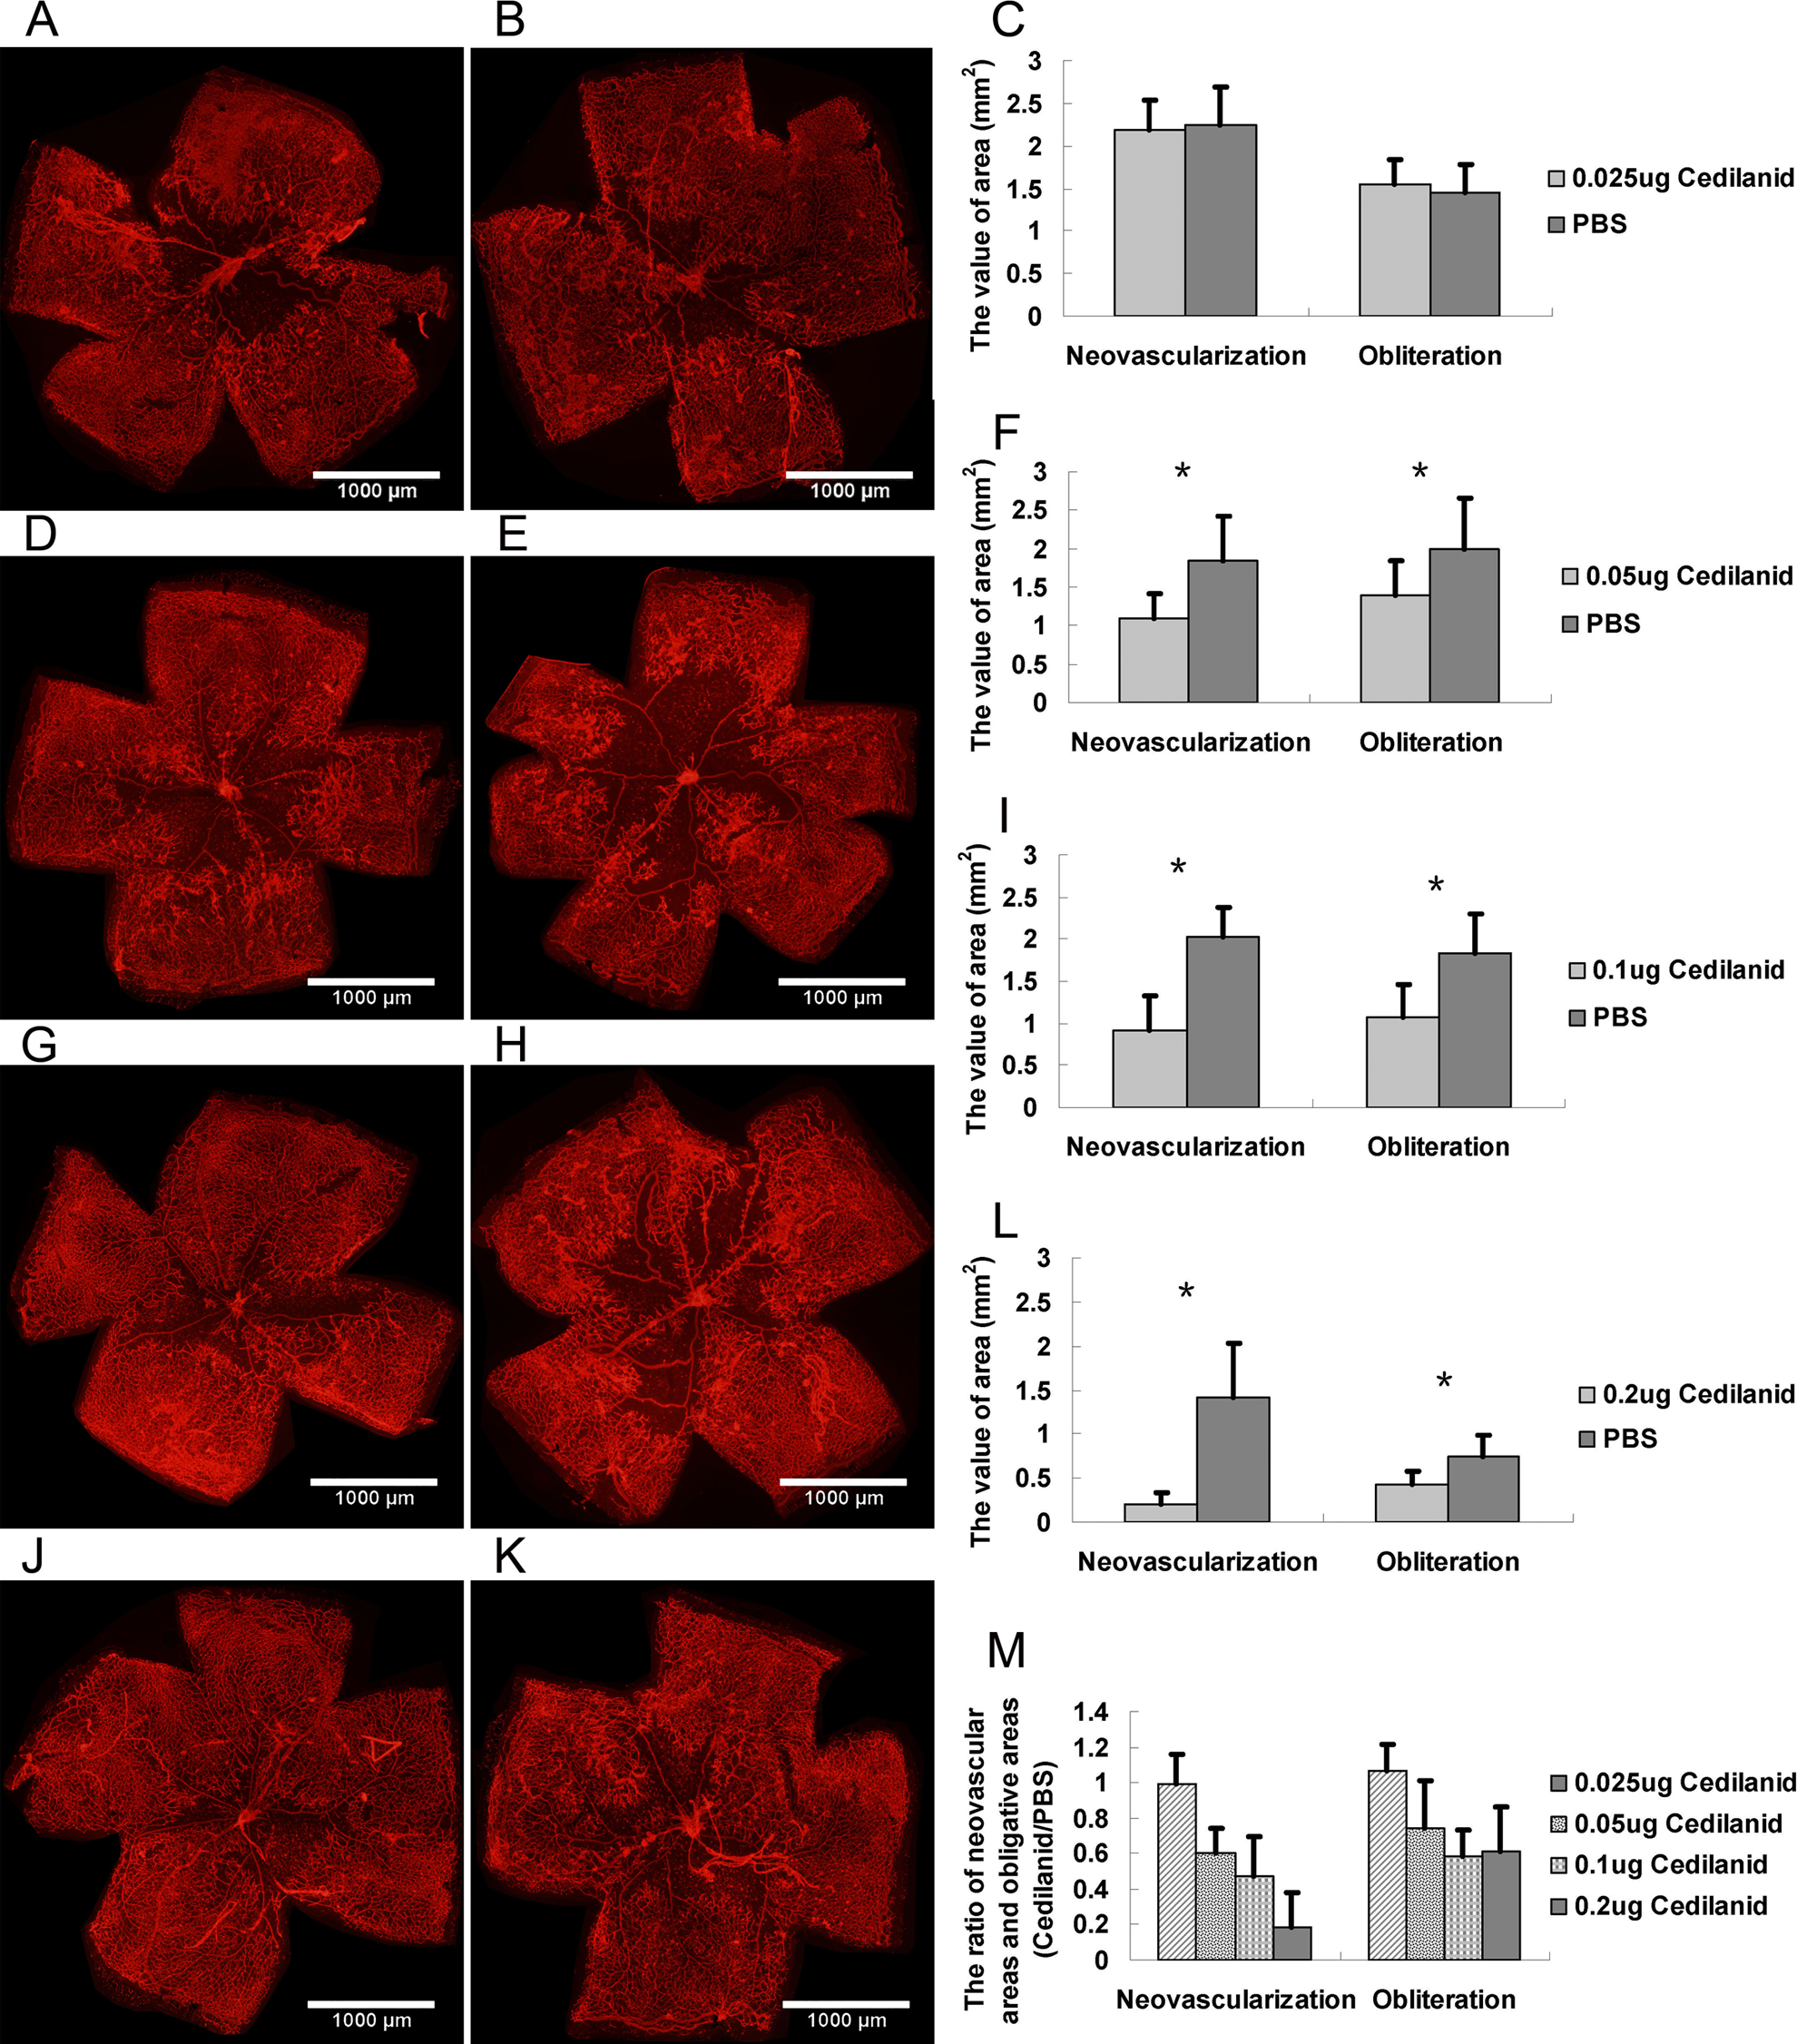
 Figure 2 of
Zhang, Mol Vis 2017; 23:346-355.
Figure 2 of
Zhang, Mol Vis 2017; 23:346-355.