Figure 3. Activity under light-adapted conditions. A: Responses (trial bin counts [TBCs]) of two example retinal ganglion cells (RGCs) to 50- and 100-fold increases in irradiance
(figures to left, ten trials per condition; square-wave diagram below indicates the stimulus epoch). B: Peri-stimulus time histogram (PSTH) showing the mean (± standard error of the mean [SEM]) firing rate across each step condition
(the dotted box indicates the stimulus epoch) for cells in A. C: Average (± SEM) spontaneous firing rate (spikes/s) of the visually responsive cells under dark-adapted conditions and at
two background light levels (BG; either 10 or 12 log photons/cm2/s; n = 9 RGCs). D: Average (± SEM) power spectral density (PSD) of the visually responsive RGCs under dark-adapted and two light-adapted conditions
with background (BG) of either 10 or 12 log photons/cm2/s (n = 9 RGCs). aCSF = artificial cerebrospinal fluid; MFA = meclofenamic acid. *** p=0.0006, **** p<0.0001.
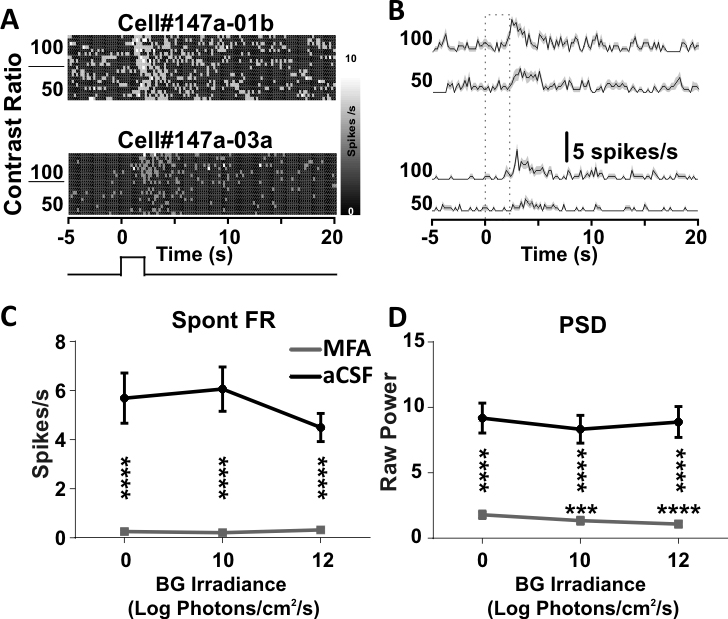
 Figure 3 of
Eleftheriou, Mol Vis 2017; 23:334-345.
Figure 3 of
Eleftheriou, Mol Vis 2017; 23:334-345.