Figure 2. Irradiance sensitivity of retinal ganglion cells from Rh-grm6 transfected retinas. A-B: Average peri-stimulus time histograms (PSTH; mean ± standard error of the mean [SEM]) across the trials for two example
single units (A and B) as a function of stimulus irradiance for artificial cerebrospinal fluid (aCSF; left) and meclofenamic acid (MFA; right)
conditions. Dotted box indicates the stimulus epoch. C-D: Example trial bin counts (TBCs) of cells in (C and D respective for A and B) for control (left) and MFA (right) conditions. Square-wave diagram indicates stimulus epoch. Trials are stacked in decreasing
order of stimulus irradiance from top to bottom. E: Perievent raster of response to highest intensity for cell in (A) showing the fine timing of the response onset. F: Population data for all responding cells displaying onset latency at stimulus irradiance giving the largest response for
each cell; n = 15 retinal ganglion cells (RGCs). G-H: Population data for all responding cells displaying the mean (± SEM) of the change in the firing rate (ΔFR; G) and the signal to noise ratio (SNR; H) across all trials as a function of the stimulus irradiance. Asterisks indicate a statistically significant difference between
aCSF and MFA at that condition; n = 18 RGCs. * p=0.0462(log12), ** p= 0.0041 (log13), ** p= 0.0079 (log14), **** p<0.0001.
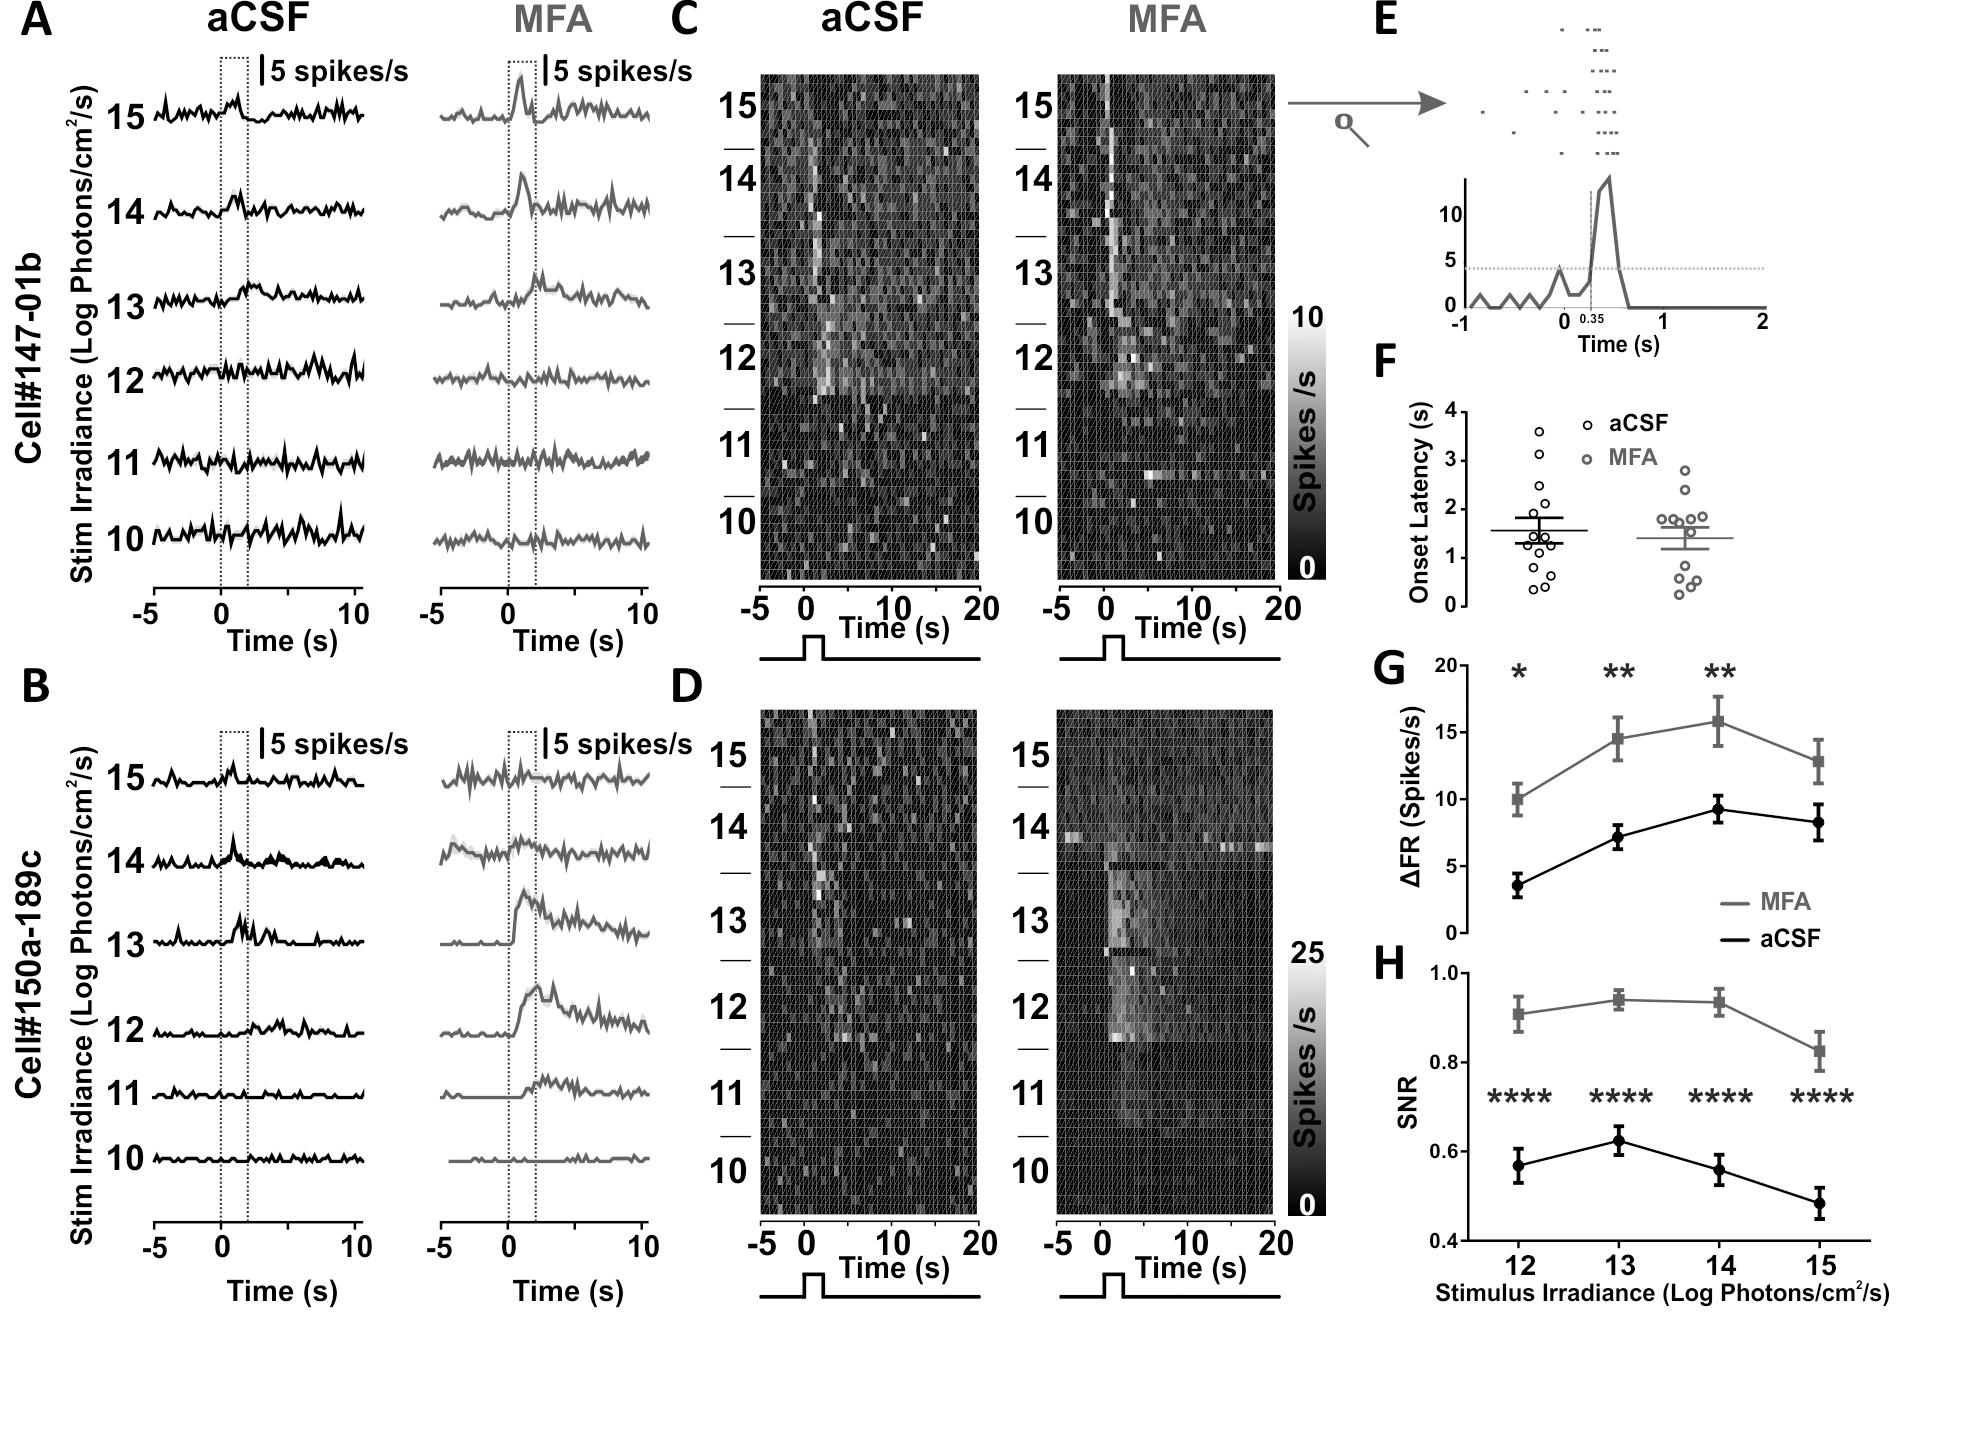
 Figure 2 of
Eleftheriou, Mol Vis 2017; 23:334-345.
Figure 2 of
Eleftheriou, Mol Vis 2017; 23:334-345.