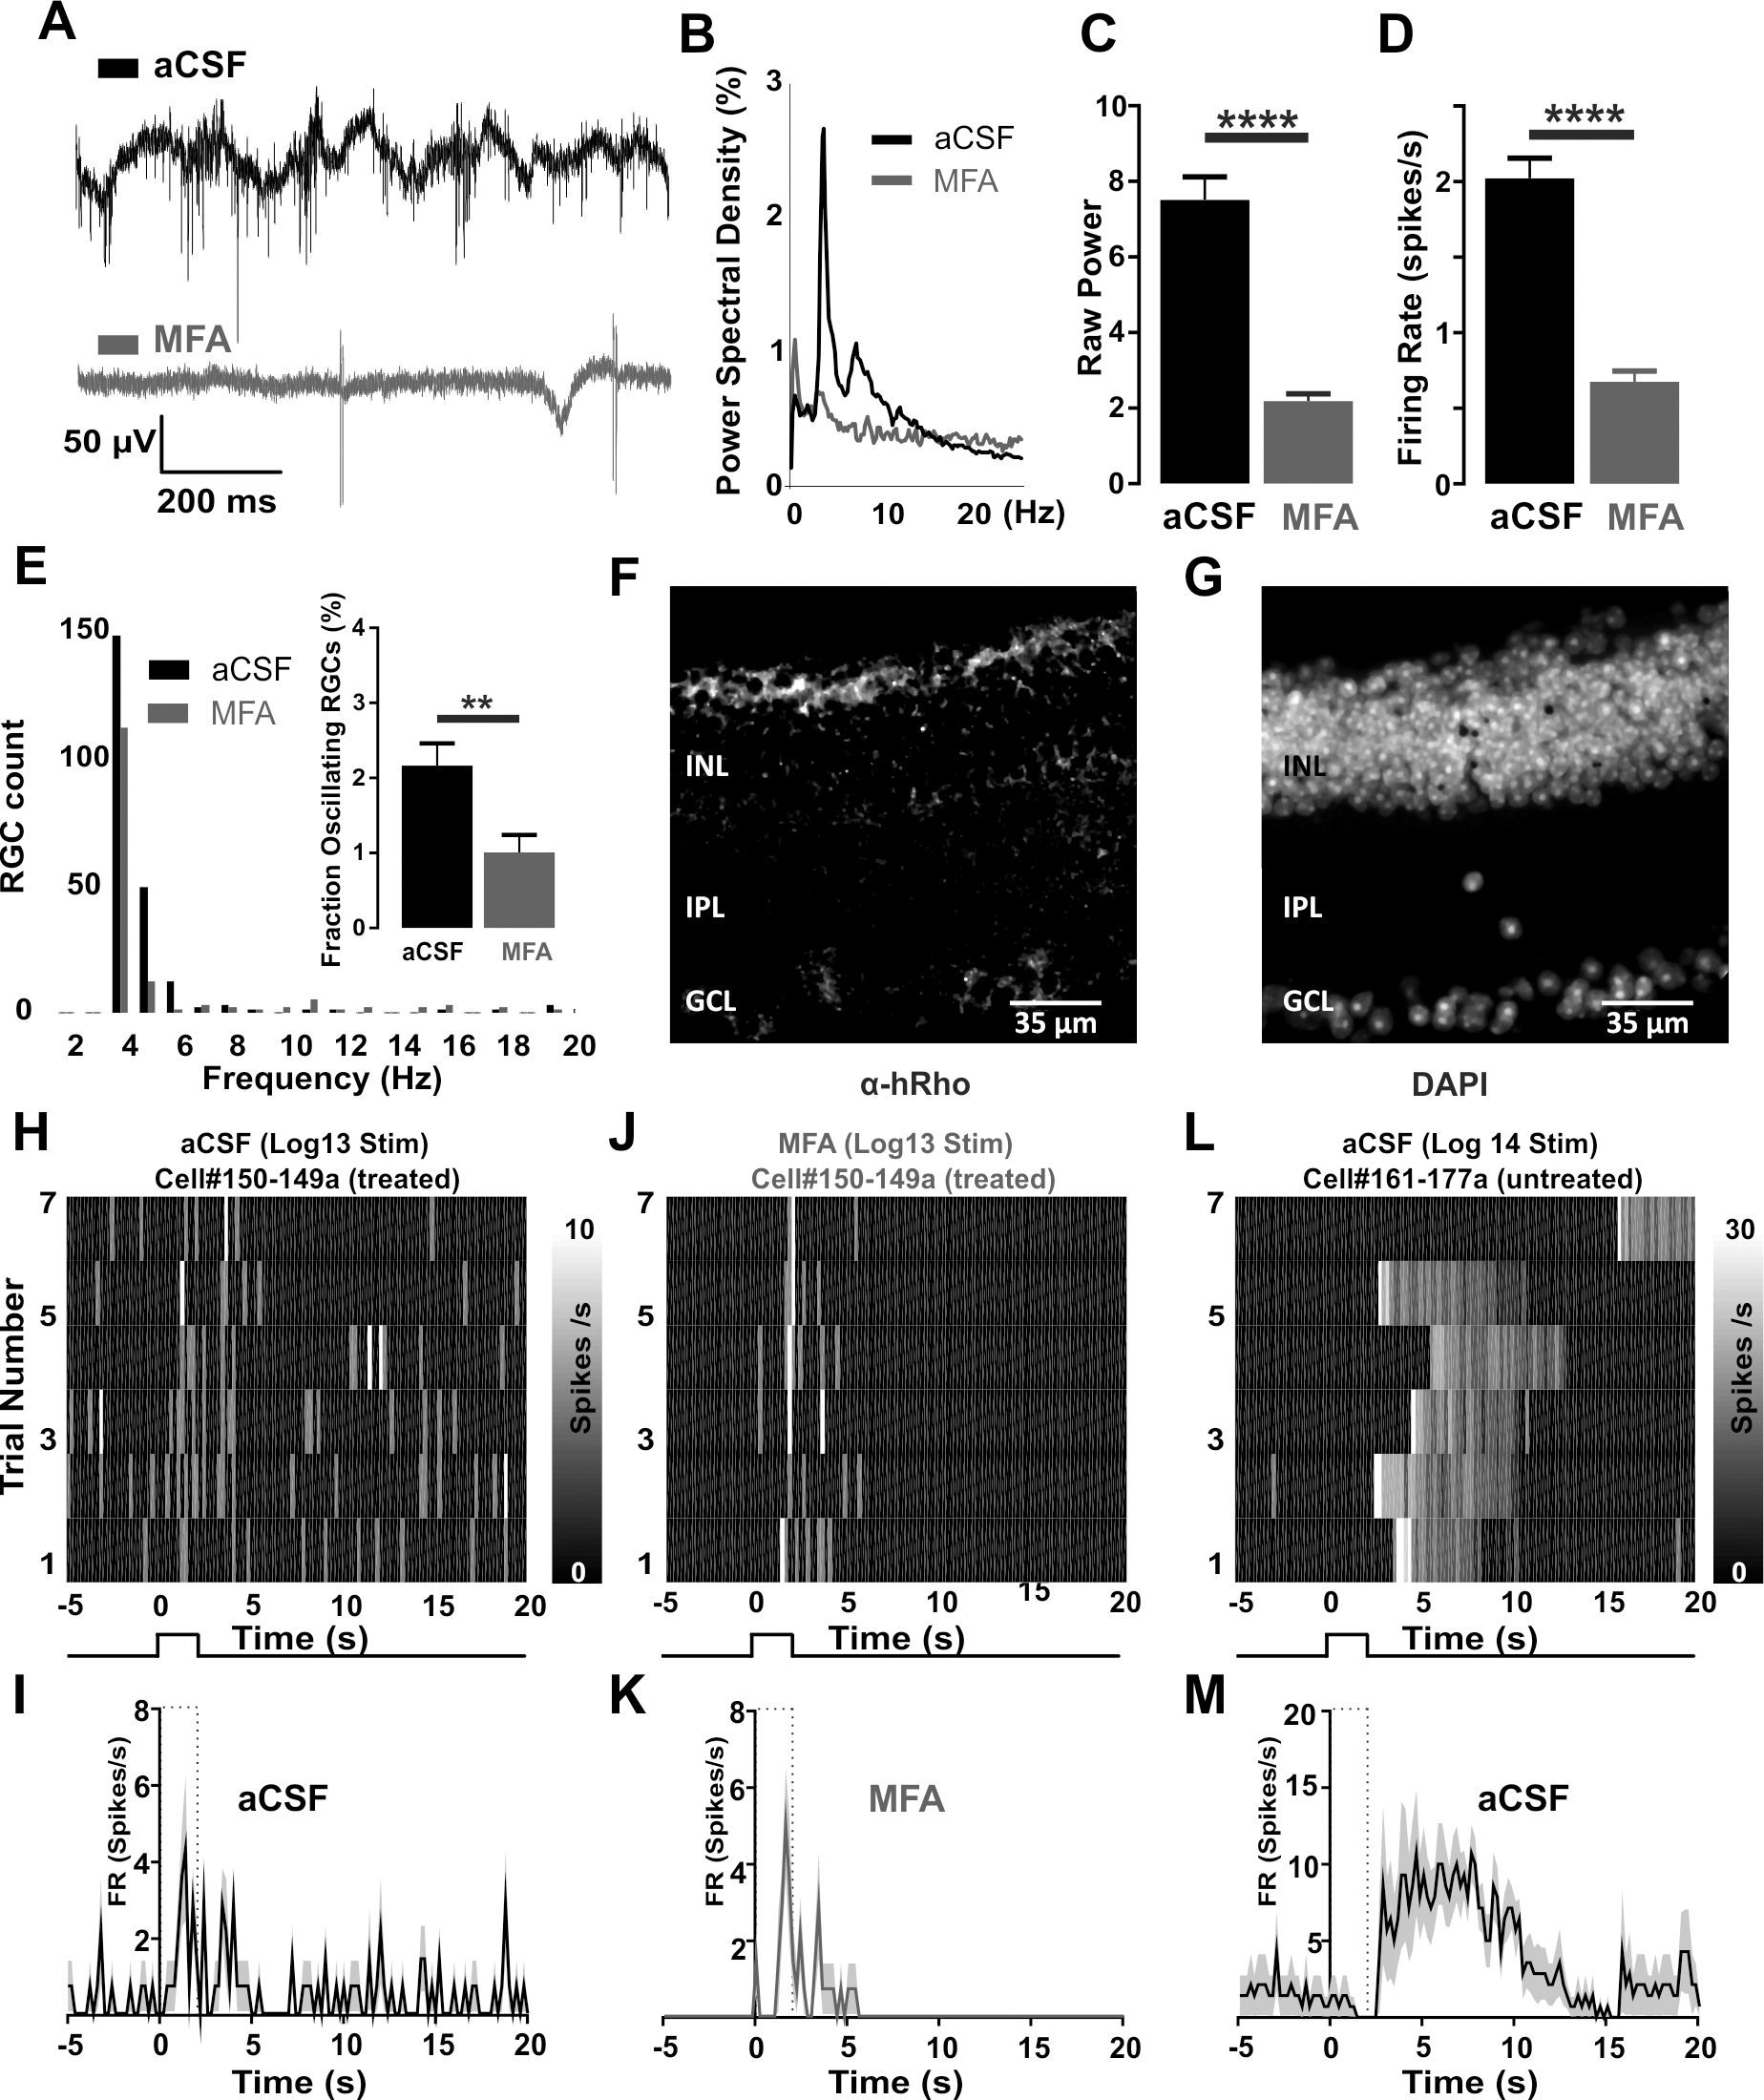
Figure 1. Impact of MFA on spontaneous and response firing.
A: Example raw traces of extracellular activity showing the same channel under control (artificial cerebrospinal fluid [aCSF])
and meclofenamic acid (MFA) conditions.
B: Power spectral density (PSD) of spiking in (
A).
C-
D: Bar graphs representing the average (± standard error of the mean [SEM]) raw overall power (
C) and spontaneous firing rate (
D) of all recorded retinal ganglion cells (RGCs); n = 417 cells.
E: Distribution of the peak frequencies of all recorded RGCs crossing a normalized power threshold of 9%. Insert: Fraction
of RGCs with a maximum normalized power value exceeding 9%; n = 9 retinas.
F-
G: Retinal section from adult C3H rd1 mouse treated with adenoassociated virus (AAV2)-grm6-Rho and fluorescently tagged for
rhodopsin (
F) and nucleic acid (
G). The signal from the rhodopsin antibody is present in the outer portion of the inner nuclear layer (INL), where the cell
bodies of ON bipolar cells reside [
32].
H-
K: Example trial bin counts (TBCs;
H,
J) and peri-stimulus time histogram (PSTH;
J,
K) of cells in aCSF (
H,
I) and MFA (
J,
K) conditions responding to a 2 s stimulus (epoch indicated by dotted box and square-wave diagrams) at an irradiance of 10
13 photons/cm
2/s from a dark background.
L-
M: Example TBC (
L) and PSTH (
M) of the melanopsin-mediated light response in the untreated retina to a stimulus of irradiance of 10
14 photons/cm
2/s. DAPI = 4',6-diamidino-2-phenylindole; GCL = ganglion cell layer; IPL = inner plexiform layer. ** p= 0.0078, **** p<0.0001.
 Figure 1 of
Eleftheriou, Mol Vis 2017; 23:334-345.
Figure 1 of
Eleftheriou, Mol Vis 2017; 23:334-345.