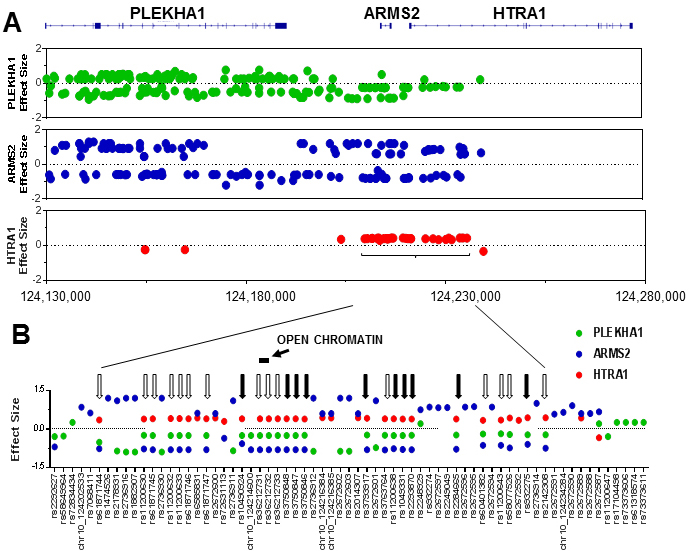
Figure 5. The locations of single nucleotide polymorphisms (SNPs) that influence the expression of
PLEKHA1,
ARMS2, or
HTRA1 (i.e., cis-expression quantitative trait loci (eQTLs)).
A: The top of the figure shows the intron–exon structures of the
PLEKHA1,
ARMS2, and
HTRA1 genes. Under the schematic genome segment are three graphs with each graph showing the locations of SNPs that affect the
mRNA expression (i.e., eQTLs) for each respective gene. The x-axis has the base pair locations, with the scale numbers at
the bottom of the three graphs based on human genome reference GRCh37/hg19. The dots are colored so they correspond to panel
B (green =
PLEKHA1, blue =
ARMS2, red =
HTRA1). To be an eQTL on this graph, an SNP must meet the threshold for significance as calculated by the GTEx software (a false
discovery rate of less than 0.5) in at least one tissue. The effect size (y-axis) is the maximum effect size across all tissues,
with positive values meaning that the minor (alternative) allele is associated with higher expression. There are some eQTLs
(75 for
PLEKHA1, 44 for
ARMS2, and four for
HTRA1) off the ends of these graphs that are not included because of size limitations.
B: Expanded view of the eQTLs in the region of the AMD-risk haplotype. The x-axis in this view is not linear. Black arrows
point to the ten SNPs that have been reported in genome-wide association studies (GWASs) and genetic studies as associated
with risk for AMD. Unfilled arrows are SNPs in strong linkage disequilibrium with the reported AMD-risk SNPs (linkage disequilibrium
r
2 >0.8) and that therefore are highly likely to be associated with risk for AMD but have not been reported as such in GWASs,
perhaps because they have not been included in those studies. Note that all AMD-risk SNPs are associated with high
HTRA1, low
PLEKHA1, and low
ARMS2 mRNA expression. Note also that there are 18 SNPs within the region of the AMD-risk haplotype in
B and more than 100 that are away from it (shown in
A) that affect the expression of
PLEKHA1 and
ARMS2 (denoted by SNPs with green or blue dots) but that have never been reported to influence risk for AMD. The location of the
open chromatin region in the RPE with the highest DNase I sensitivity is indicated as a horizontal bar. Not shown is the ins/del
polymorphism esv2663177 (del443/ins54) which is between
rs3750846 and
rs3793917.
 Figure 5 of
Liao, Mol Vis 2017; 23:318-333.
Figure 5 of
Liao, Mol Vis 2017; 23:318-333.