Figure 4. Correlation analysis between the probe signal and the bacterial load by culture for the 16 patients with bacterial keratitis.
A–C: The standardized intensities of the three universal bacterial probes (PB1, PB2, and PB3) with the corresponding bacterial
load by culture for each patient are shown. D: The standardized intensities for the Psu probe with the corresponding bacterial load by culture for Pseudomonas spp. for each patient are shown. ρ, Spearman correlation coefficient; p<0.05 was considered statistically significant.
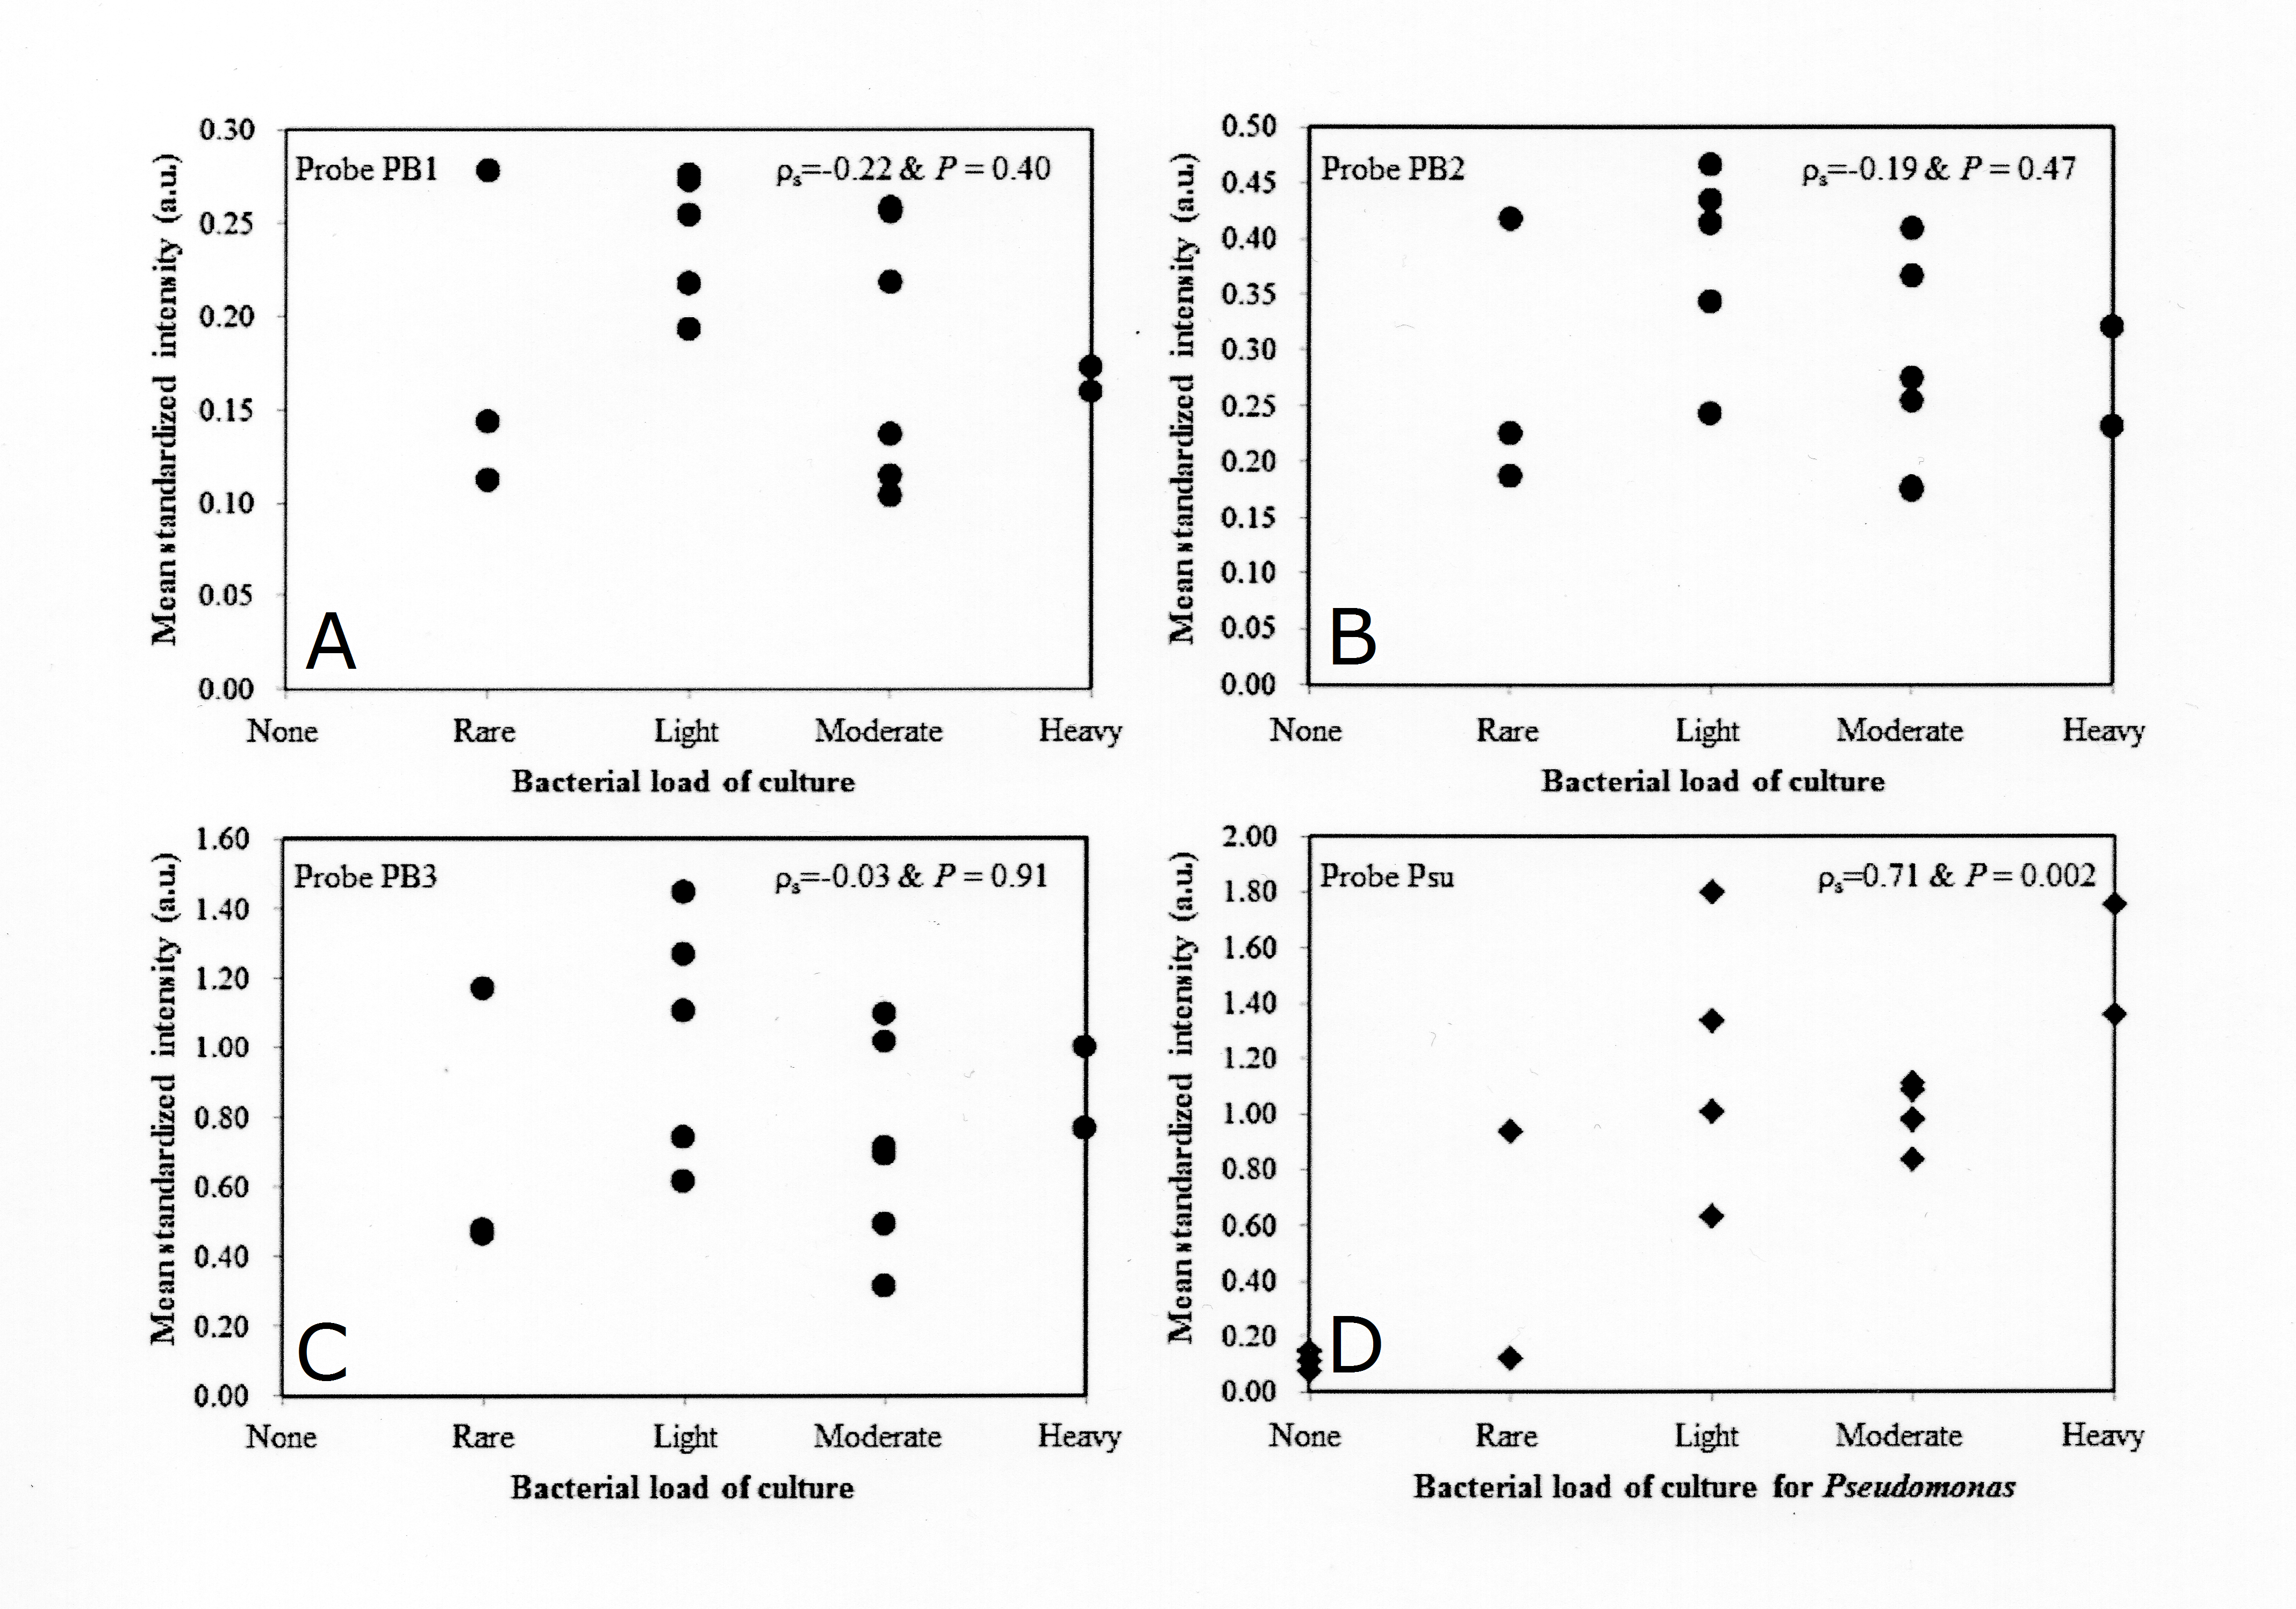
 Figure 4 of
Fang, Mol Vis 2017; 23:306-317.
Figure 4 of
Fang, Mol Vis 2017; 23:306-317.