Figure 6. TNF-α protein expression at different time points in the aqueous humor after alkali burn. Notes: μg /l refers to protein concentration;
* and ** refer to p<0.05 and p<0.01 when compared with the normal control group, respectively; # and ## refer to p<0.05 and
p<0.01 when compared with the empty vector group, respectively. TNF, tumor necrosis factor.
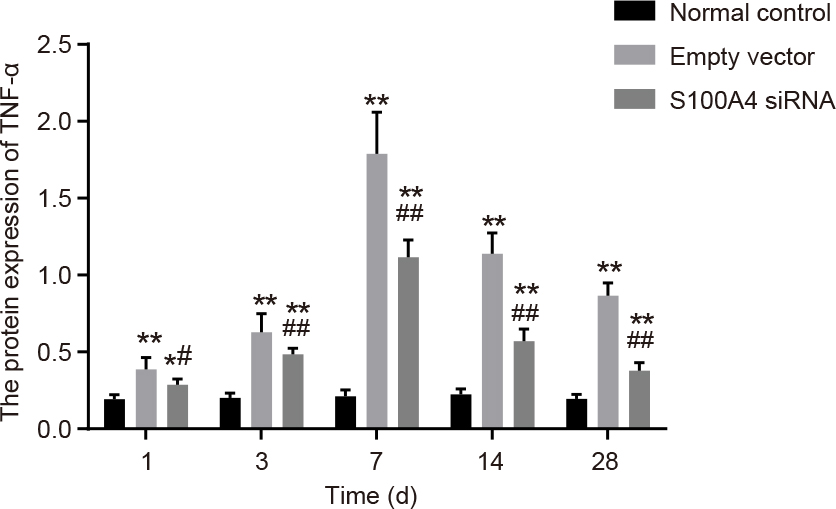
 Figure 6 of
Wang, Mol Vis 2017; 23:286-295.
Figure 6 of
Wang, Mol Vis 2017; 23:286-295.