Figure 3. The mRNA expressions of S100A4, VEGF, and TNF-α after alkali burns at each time point for each group. Notes: mRNA, microRNA;
VEGF, vascular endothelial growth factor; TNF, tumor necrosis factor; * and ** refer to p<0.05 and p<0.01, respectively when
compared with the normal control group; # and ## refer to p<0.05 and p<0.01, respectively when compared with the empty vector group.
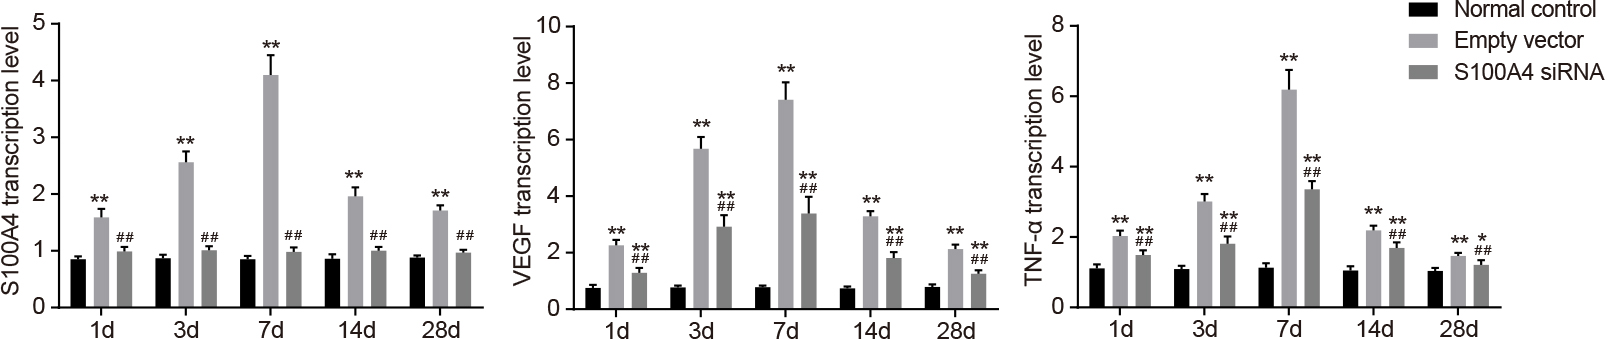
 Figure 3 of
Wang, Mol Vis 2017; 23:286-295.
Figure 3 of
Wang, Mol Vis 2017; 23:286-295.